Q2 2025 Economic & Market Review [Webinar Summary]

Presenters: Lowell Pratt, CFA, Andy Pratt, CFA, CAIA, and Adam Newman, CFA, CFP®
Here is the webinar recording from July 16, 2025. You can browse the topics discussed and main takeaways using the sections and time stamps below:
- 00:00 - Introduction and New Podcast
- 02:30 - Q2 Market Performance Overview
- 07:44 - Long-Term Market Summary
- 09:19 - Don't Fear All-Time Highs
- 11:24 - Household Leverage and Unemployment Rates
- 13:50 - Understanding the One Big Beautiful Bill Act (OBBBA)
- 24:12 - How We Handle Volatility
- 27:16 - Size and Style Performance
- 28:59 - Large Cap Dominance
- 32:17 - Mid Caps Favor Value
- 32:57 - Small Caps: No Clear Trend
- 33:36 - New Style for Large, Mid, and Small Caps
- 36:17 - Deep Dive Q&A
Click the time stamp in each section title to jump to that part of the video on a new screen.
Introduction and New Podcast (00:00)

- This quarter provided very solid returns on both an absolute and relative basis.
- We will discuss the recently enacted "big beautiful bill" and its investment implications.
- A new podcast, "The Long Story Short," has launched with weekly 30-45 minute episodes covering markets to financial planning. Episodes are released every Friday on Spotify, Apple Podcasts, and YouTube.
Q2 Market Performance Overview (02:30)


- Despite a 19% top-to-bottom market decline, trade war discussions, and Middle East tensions, the market showed incredible resilience with a V-shaped recovery.
- Global stock markets bounced double digits, with the US market up about 11% and international and emerging markets up about 12%.
- This resilience was driven mainly by earnings, the health of the labor market, and consumer strength.
- Fixed income posted an average quarter despite yield and currency movements around trade discussions.
- The market's focus on fundamentals over headlines was a great reminder of its underlying strength.
Long-Term Market Summary (07:44)
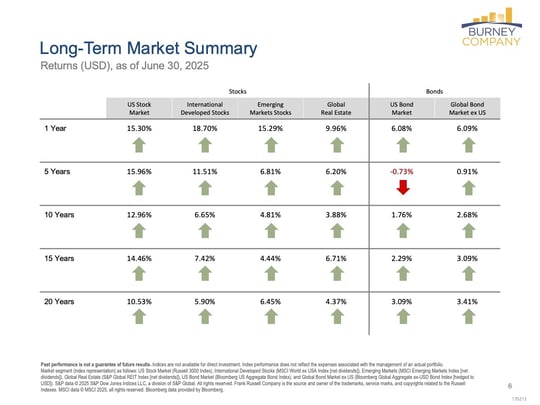
- Market returns are now showing broader participation beyond the "Mag Seven" technology stocks, with sectors like industrials and utilities leading the rebound.
- Wall Street strategists' annual price targets often move reactively with market performance, making them unreliable predictors.
- Global participation in the stock market rally has broadened, with international developed equity leading for the first time in years.
- Bond returns have stabilized with higher starting yields after the historic 2022 decline, providing better forward-looking opportunities.
- The current environment shows encouraging trends for both domestic and international investments after years of US-only outperformance
Don't Fear All-Time Highs (09:19)
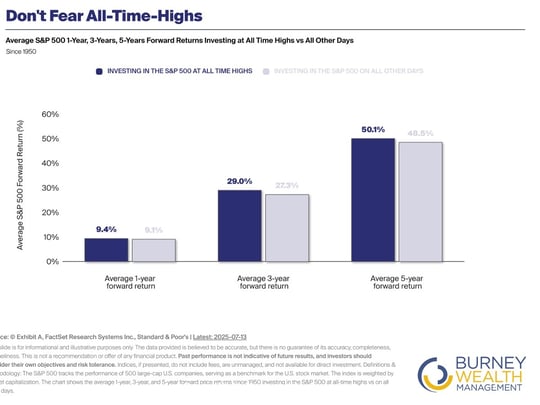
- Despite an almost 20% market decline just months ago, questions arise about all-time highs and whether investors should take profits.
- All-time highs are actually a positive indicator for future stock returns, with forward-looking returns from these levels typically being higher.
- Above-average returns tend to cluster around one another, suggesting investing from a position of strength is favorable.
- The current broad-based rally occurs from a favorable economic backdrop with strong fundamentals supporting the market.
Household Leverage and Unemployment Rate (11:24)
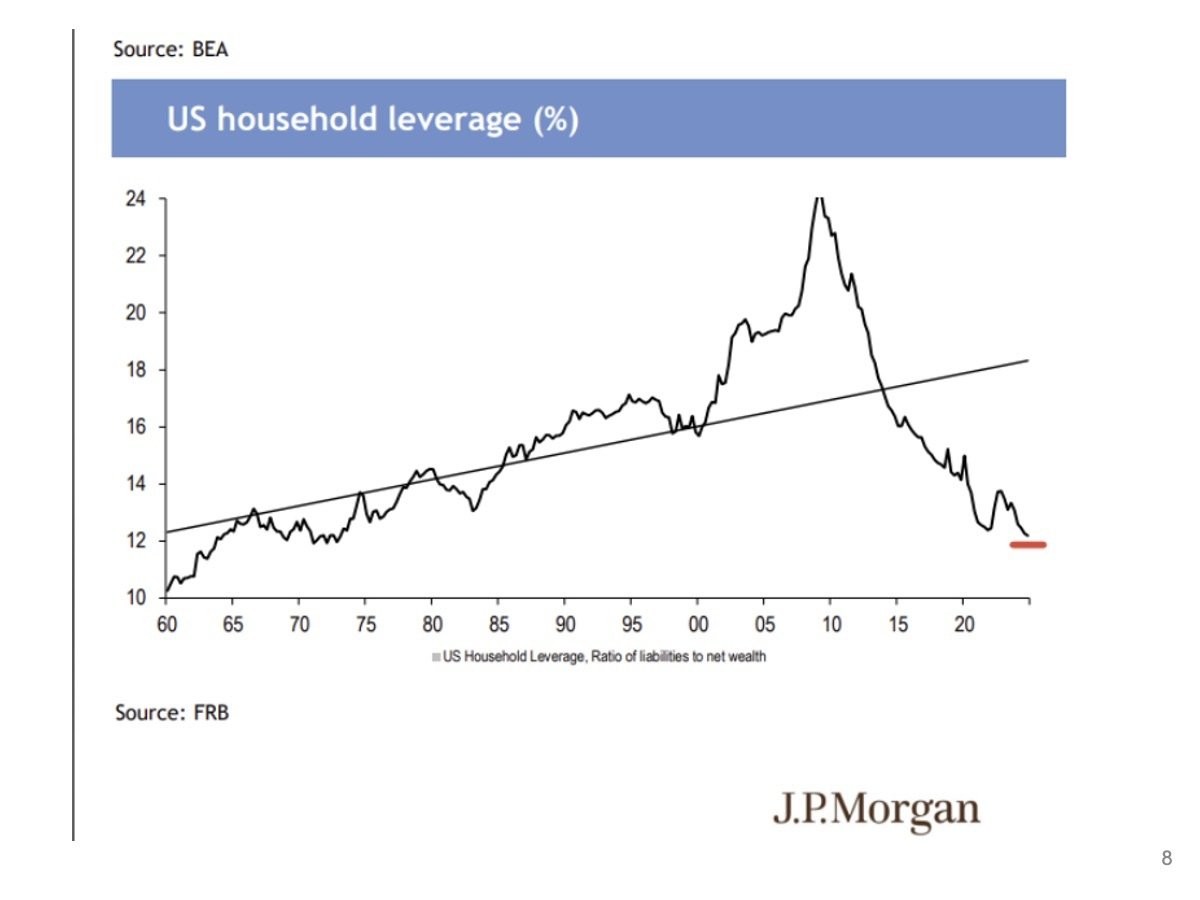
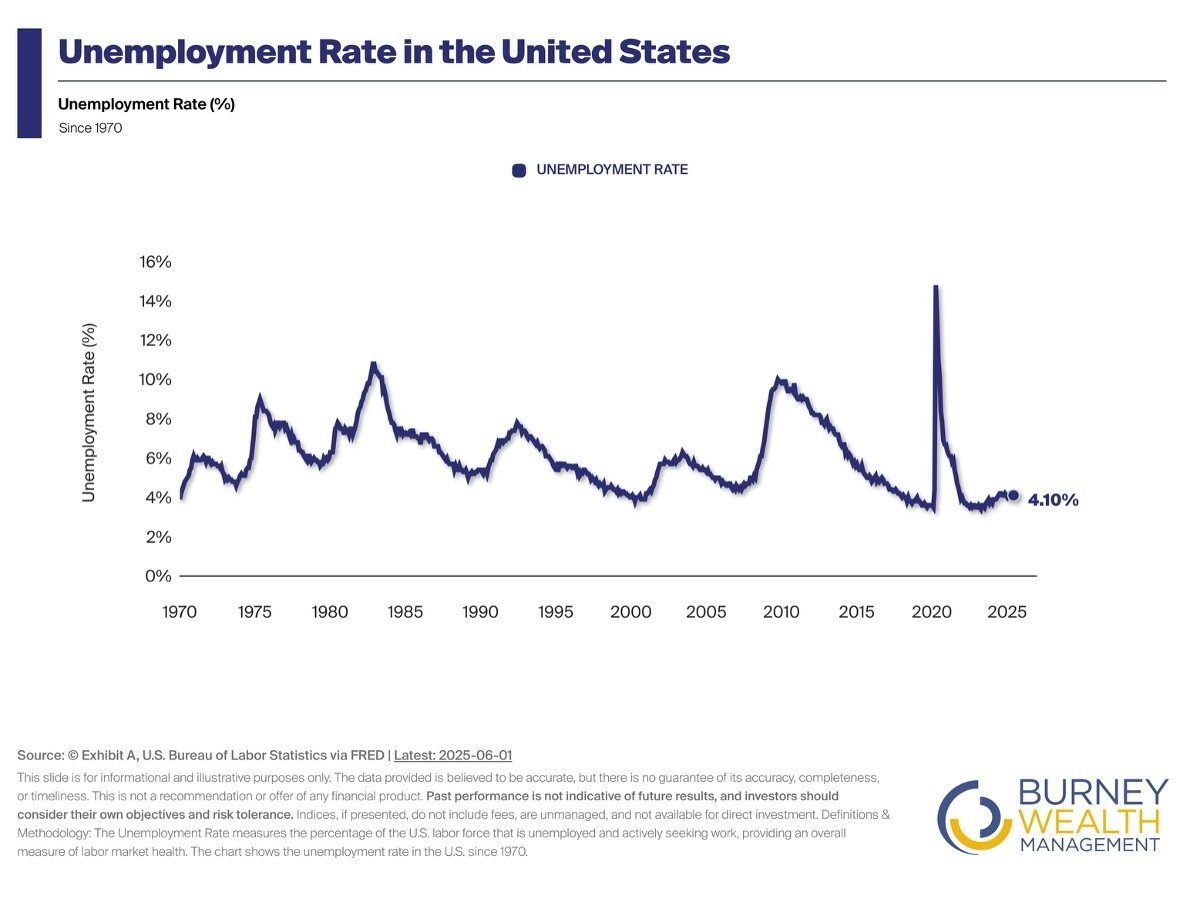
- Despite headlines about consumer debt and credit card debt reaching new all-time levels, household leverage (ratio of liabilities to net worth) remains at record low levels.
- While liabilities might be rising slightly on a dollar basis, assets are rising at a much greater pace, creating a very under-leveraged consumer with US households in better shape than historically.
- The job market continues to show incredible resilience, with unemployment still hovering around 4%, defying expectations of spikes that were anticipated since 2022 rate hikes began.
- While wage growth is slowing from previously aggressive levels, the labor market has remained steady in a higher rate environment where the economy is still growing but slowing down appropriately.
- This represents a really steady labor market performance that has consistently surprised to the upside, contributing to the overall positive economic backdrop.
Understanding the One Big Beautiful Bill Act (OBBBA) (13:50)
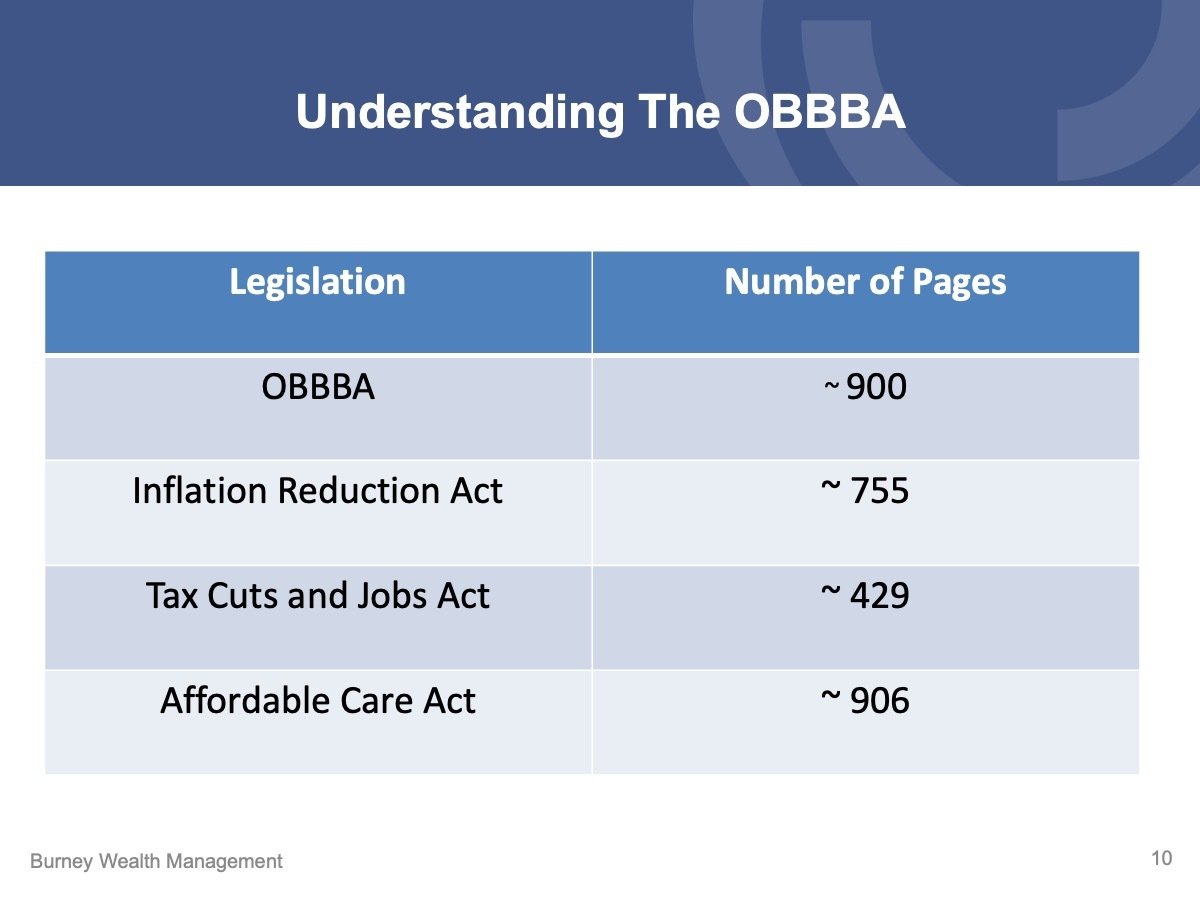
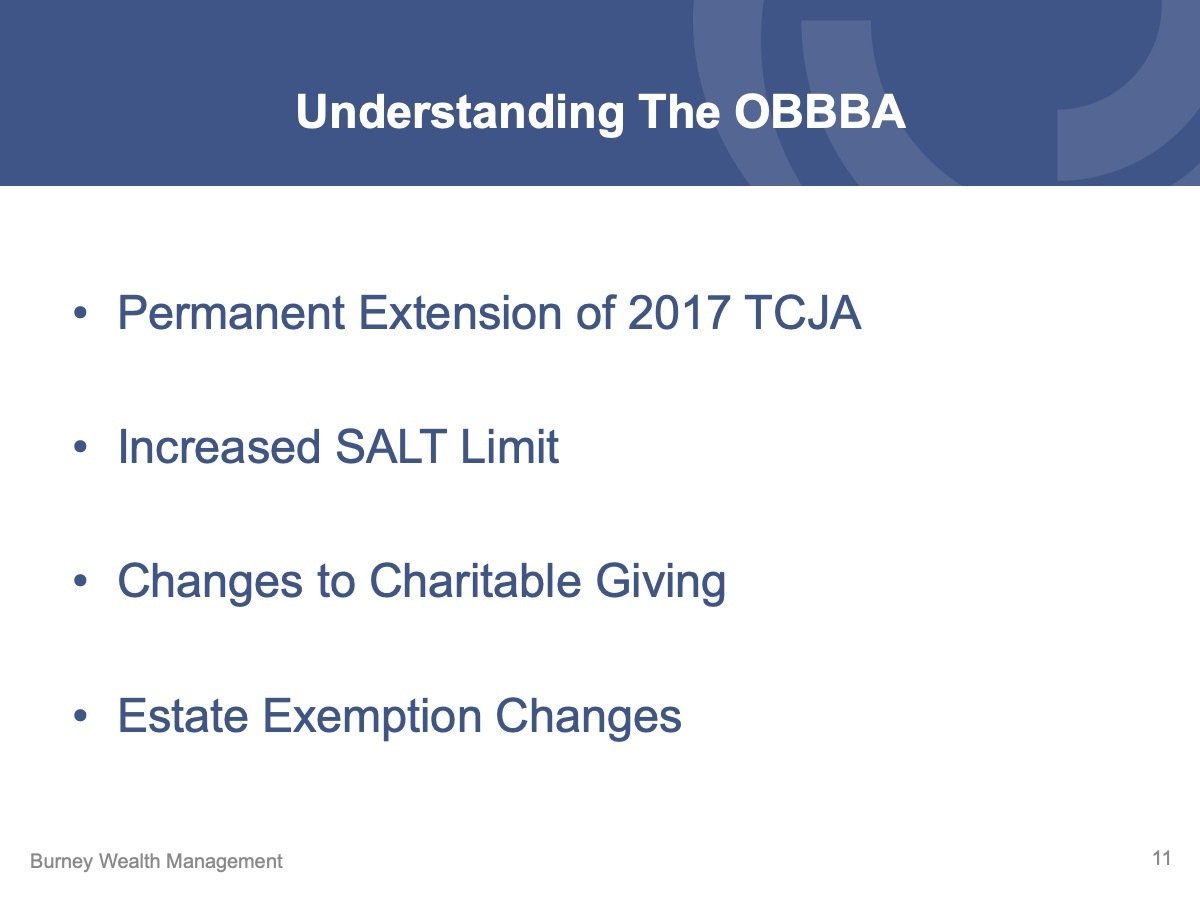
- The 900-page OBBBA permanently extends the 2017 Tax Cuts and Jobs Act income tax rates, providing planning certainty.
- The SALT limit increases to $40,000 for 2025-2029, phasing out for incomes over $500,000 and returning to $10,000 at $600,000.
- A new senior deduction allows those 65+ to deduct an additional $6,000 per person through 2028, regardless of itemizing status.
- The estate tax exemption permanently increases to $15 million per person, allowing married couples to transfer $30 million without estate tax.
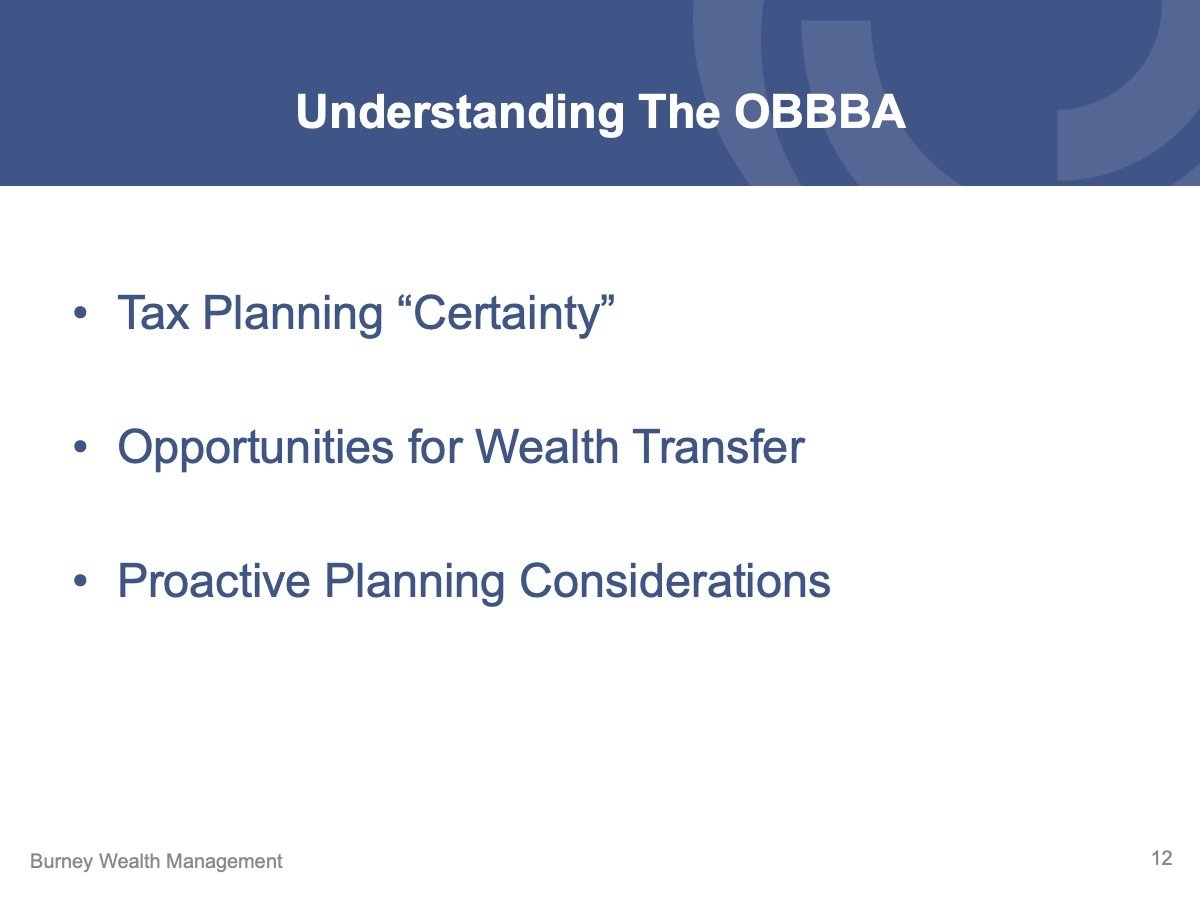
- The mid-year passage provides six months for proactive planning around Roth conversions, distribution planning, and wealth transfer strategies.
*You can find our full explanation of the OBBBA and what it may mean for you in our latest blog: Understanding the One Big Beautiful Bill Act (OBBBA): What High Net Worth Families Need to Know.
How We Handle Volatility (24:12)

- Comparing feelings from the April market stress to today's all-time highs illustrates the difference between "hot states" and "cold states" of thinking.
- In hot states, fear responses overwhelm rational thinking, while cold states allow for clearer decision-making.
- Planning now for future market declines, while in a rational state, helps prepare for inevitable volatility.
- Staying the course during tough times is the most important factor for long-term investment success.
Size and Style Performance (27:16)

- The past month saw unusual performance with both large growth stocks and small value stocks performing well, despite typically being opposites.
- Large growth includes trillion-dollar technology companies like Apple, Meta, Microsoft, and Nvidia.
- Small value companies typically have one to two billion in market cap and are often profitable but "boring" companies.
- Year-to-date, large caps (especially large growth) have significantly outperformed smaller market segments.
Large Cap Dominance (28:59)
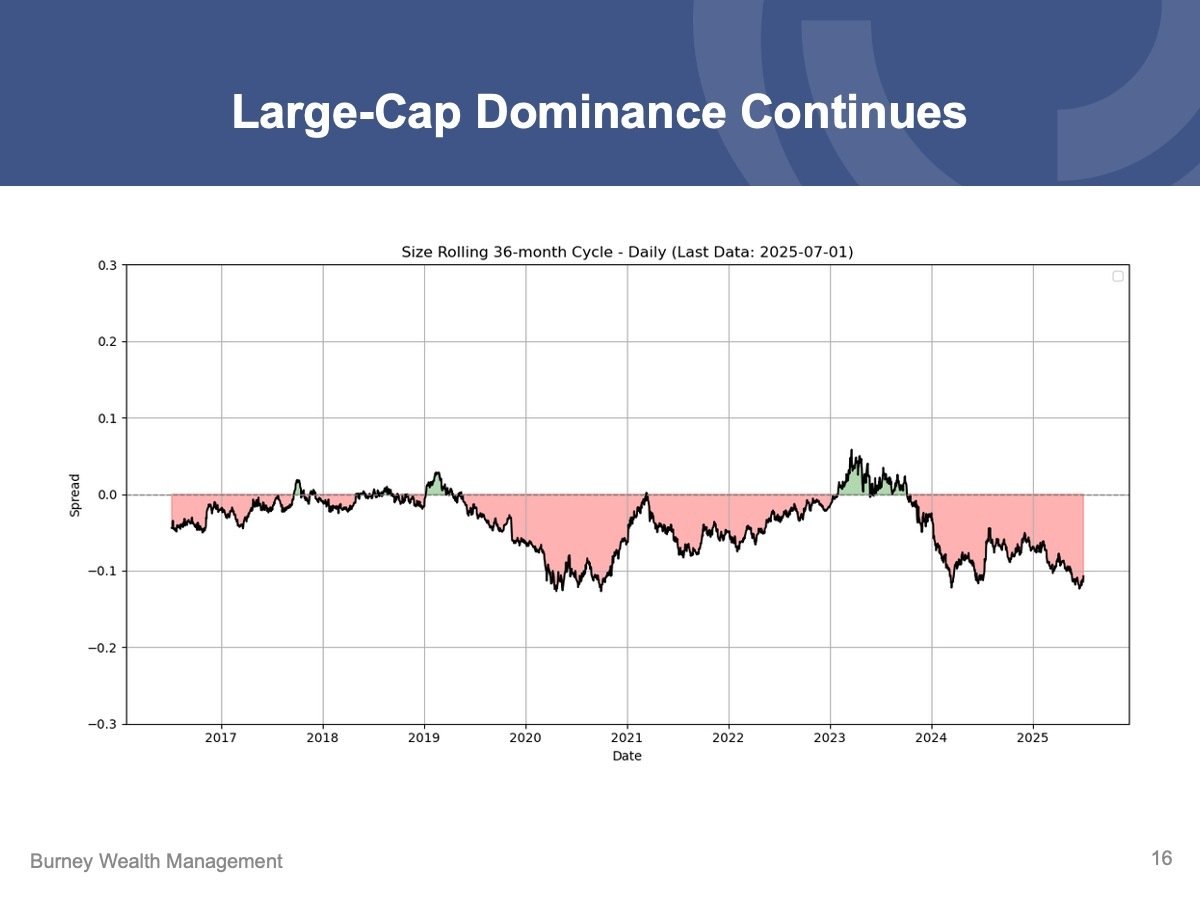
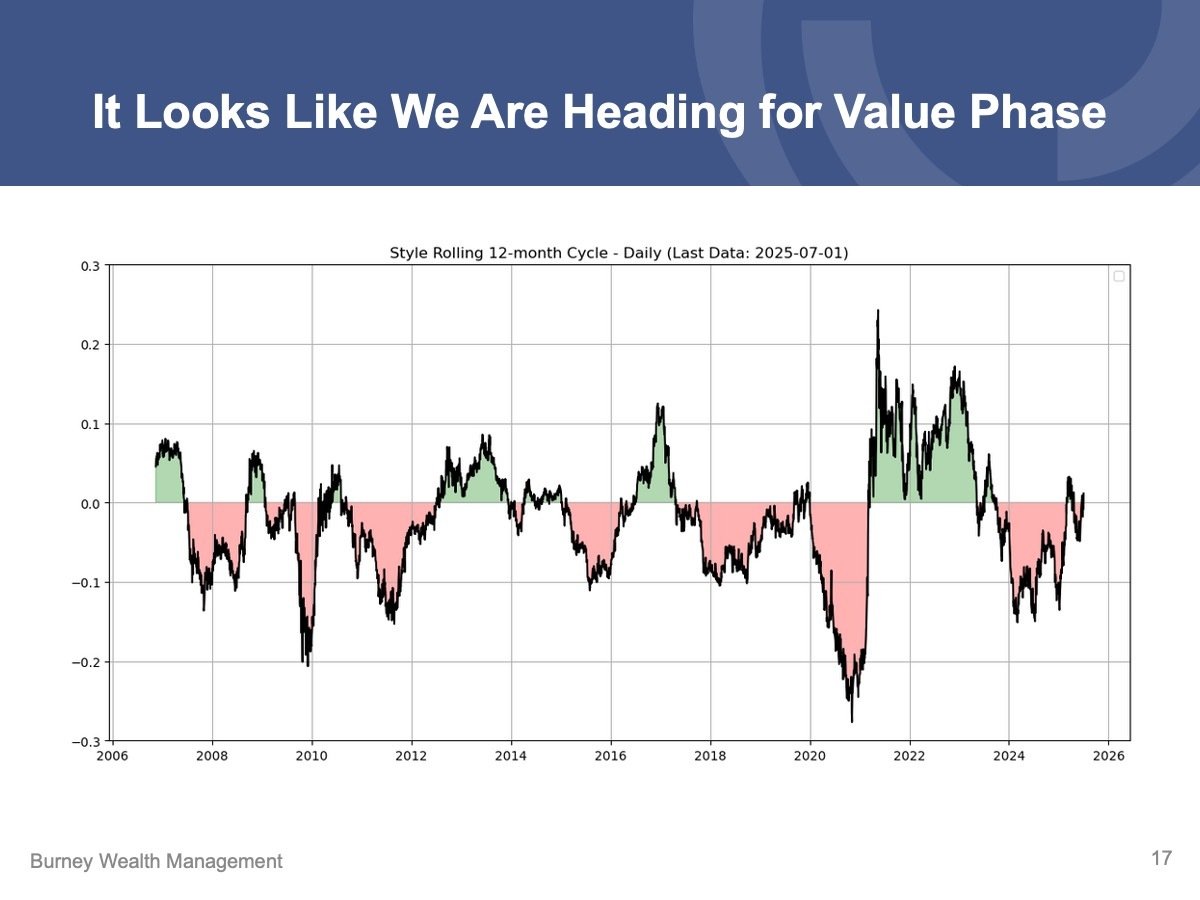
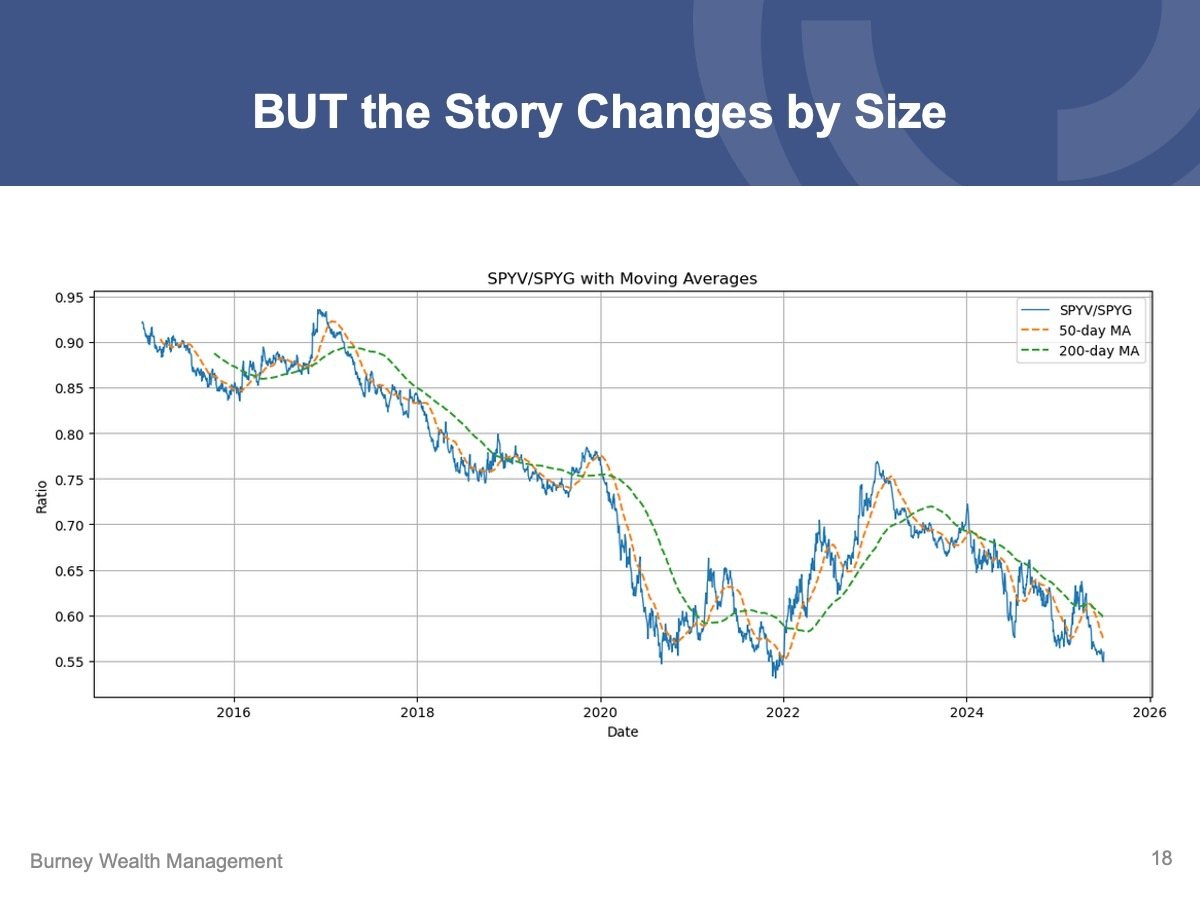
- The "wave chart" shows mostly red (large-cap outperformance) over the past decade, with only brief periods of small-cap strength.
- Small-cap stocks performed well coming out of COVID and had momentum in early 2023, but large-cap dominance has been the primary trend.
- The market appears to be rotating towards value overall, with a clear trend line developing over the past year.
- However, large-cap and mid/small-cap stocks are behaving differently, with large growth maintaining momentum since 2023.
Mid Caps Favor Value (23:17)
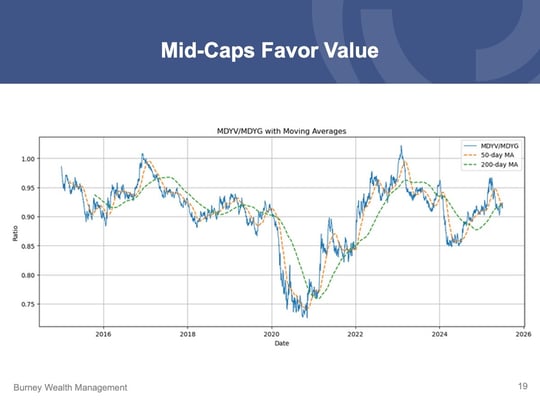
- Mid-cap stocks ($2-10 billion market cap) show the opposite trend from large caps, with value significantly outperforming growth.
- Mid-value had strong outperformance coming out of COVID, followed by a short pro-growth period from 2023 to mid-2024.
- Since mid-2024, there has been sustained mid-value outperformance over mid-growth stocks.
- This creates an interesting dynamic where large growth outperforms large value while mid-value outperforms mid-growth simultaneously.
Small Caps: No Clear Trend (32:57)

- Small caps experienced a big value rally from 2020 to 2023, followed by a growth move downward.
- Since then, the trend has been sideways with a short, small-value rally before slipping back down around Liberation Day.
- The small-cap situation remains unclear compared to the clearer trends in the large and mid-cap segments.
- While small caps lack direction, there appears to be momentum building back towards small value again.
New Style for Large, Mid, and Small Caps (33:36)
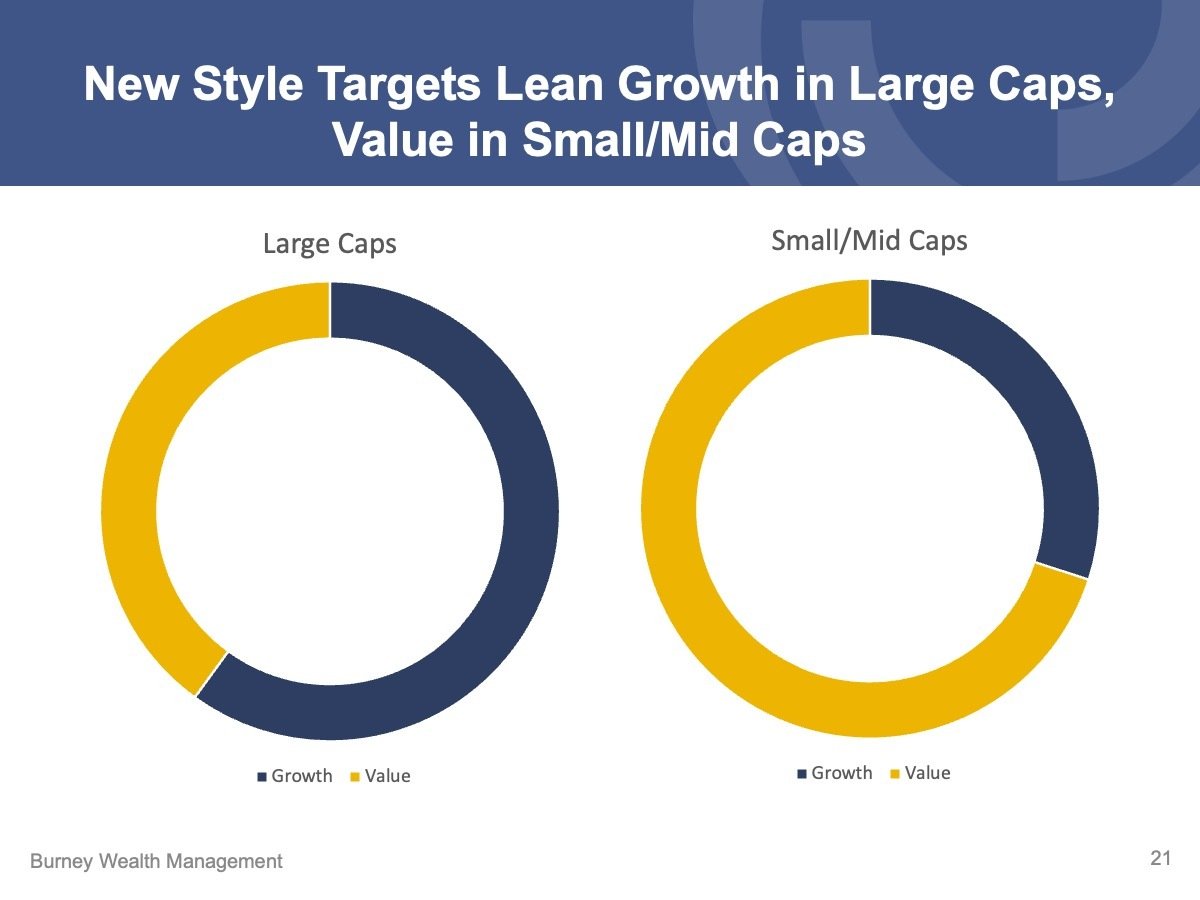
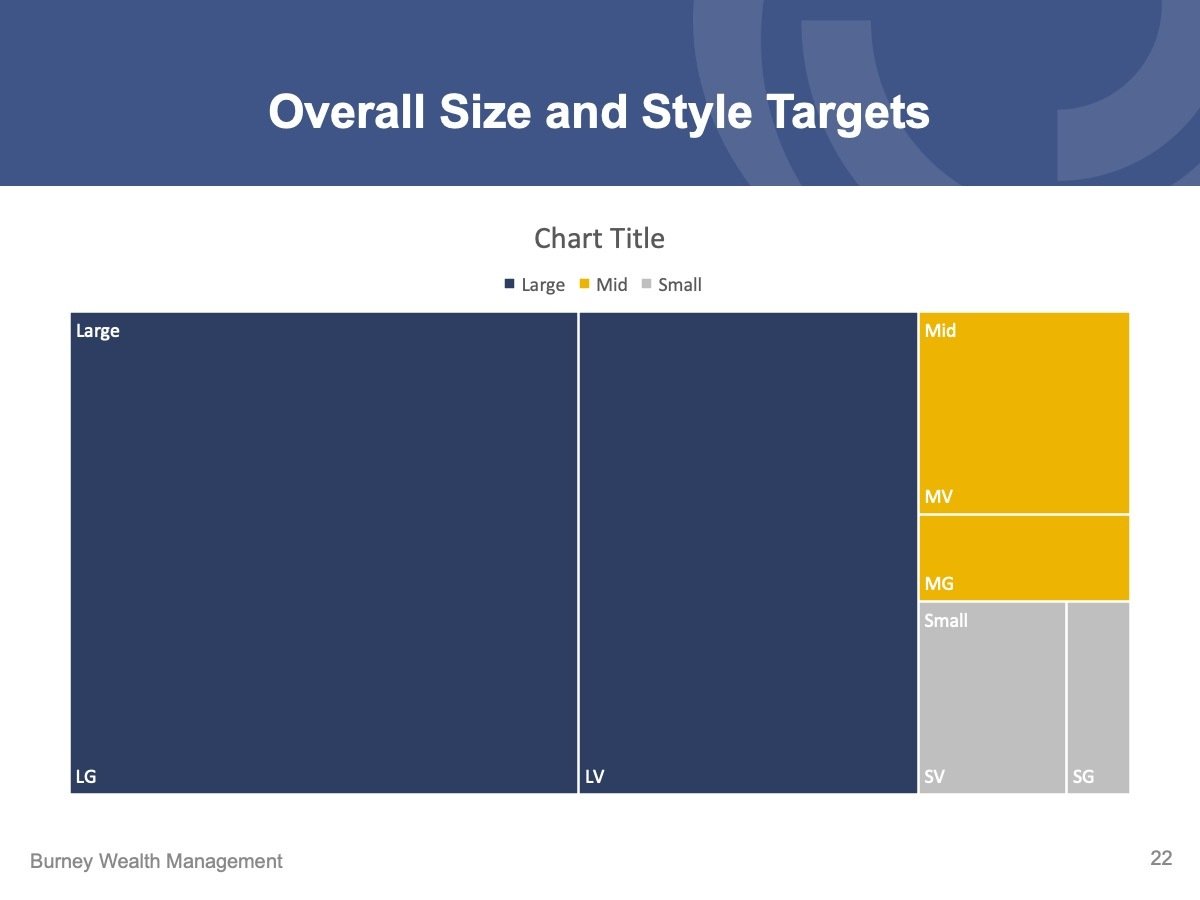
- For the first time, the style decision (value vs. growth) has been separated by market cap, with large caps leaning growth and mid/small caps leaning value.
- Portfolio allocation shows 80% in large caps (with large growth weighted higher), while mid and small caps favor value over growth.
- This approach plays both growth and value simultaneously, depending on company size, as a reaction to real-time market data.
- The AI trade likely contributes to this trend, with the biggest winners being mega-cap companies like Microsoft, Meta, and Nvidia.
- This divergence appears to be uniquely a US mega-cap phenomenon, with value expected to outperform growth long-term in mid and small caps, as well as internationally.
Deep Dive Q&A (36:17)
-
Questions addressed in the Q&A session included:
- What kind of impacts can we expect from domestic investments in a scenario where the dollar is no longer the reserve currency?
- Will international equities continue outperforming US equities, potentially with the weakening dollar being a source for growth?
- What is your outlook for quarters three and four, both economically and for the stock market?
- How should we handle the tariff issue if current policies don't change, and what's the effect on portfolios?
- Can you explain what's happened in the bond market over the last six months and provide thoughts on future directions?
- How are you using AI in portfolios, and how are you adjusting portfolios to accommodate likely market disruptions from AI?
If you have questions like these or wish to discuss your financial planning needs, Schedule a Meeting with us.
CNBC’s annual FA 100 ranking was published on 10/2/2024 for the year 2024. The Burney Company did not pay CNBC any compensation for being considered for the list, however, Burney Company does pay a licensing fee to use the CNBC logo in marketing materials. A link to the CNBC selection criteria can be found by going to https://cnb.cx/3Pg6FVh. The CNBC award was given to the Burney Company, which includes portfolio managers associated with Burney Wealth Management and nine other affiliated portfolio managers.
The Burney Company is an SEC-registered investment adviser. Burney Wealth Management is a division of the Burney Company. Registration with the SEC or any state securities authority does not imply that Burney Company or any of its principals or employees possesses a particular level of skill or training in the investment advisory business or any other business. Burney Company does not provide legal, tax, or accounting advice, but offers it through third parties. Before making any financial decisions, clients should consult their legal and/or tax advisors.


