



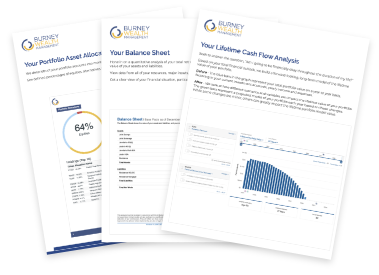
A team to guide you
Our team of advisors guide you through various retirement scenarios, quantify your goals and plan for life’s uncertainties before crafting a retirement plan that aligns with the future you envision.

Presenters: Lowell Pratt, CFA, Andy Pratt, CFA, CAIA, and Adam Newman, CFA, CFP®, MT, RICP®, CEPA
Here is the webinar recording from July 22, 2026. You can browse the topics discussed and main takeaways using the sections and time stamps below:
- (00:54) Introduction
- (02:28) Q2 Market Performance Overview
- (04:54) Long-Term Market Summary
- (06:30) Fundamentals Driving the Rally: Earnings and Economic Growth
- (08:22) Valuations: Why P/E Multiples Are Contracting
- (13:42) US Equity Strategy: Size and Style Performance
- (16:16) Market Breadth Is Widening
- (19:31) Small-Cap Rally: How Far Can It Go?
- (20:51) Growth vs. Value: Momentum Still Favors Growth
- (25:09) How Burney's Investment Process Has Evolved
- (32:52) Deep Dive Q&A
Introduction
- Q2 delivered the best quarter for global equity markets since the second quarter of 2020, the rebound out of the initial COVID sell-off.
- April and May 2026 alone ranked among the top five best two-month stretches for the US market in more than 40 years. Stretches like that typically follow sharp crisis periods, such as 2008 or 2020.
- Emerging markets led the way this quarter, up almost 25%, continuing a second straight year of international stocks outperforming the US.
- The quarter was equity-heavy. Bonds posted fairly normal returns for the first time in a handful of years, a welcome change after a difficult stretch since 2022.
Q2 Market Performance Overview
- Enthusiasm around AI, earnings growth, and broader economic growth drove the quarter.
- International stocks continue closing the gap on the US, though there is still a long way to go after 15 years of US dominance.
- Investors with any level of diversification, whether international equities, fixed income, or other assets, are starting to be rewarded for staying disciplined.
Long-Term Market Summary
- Looking at 1, 5, 10, and 15-year windows shows the same broad trends holding up.
- The bond market has finally posted more normal returns despite ongoing headline volatility around interest rates, driven largely by geopolitics and sticky inflation.
- This is a notable shift for anyone who has held a meaningful fixed income allocation and wondered, since 2022, why it was even in the portfolio.
Fundamentals Driving the Rally: Earnings and Economic Growth
- The market keeps climbing this year despite geopolitical headlines, and the team pointed to a clear fundamental case behind it.
- Forward-looking sector data from FactSet and S&P show nearly every S&P sector, aside from staples and real estate, expected to post double-digit earnings growth over the next 12 months.
- Technology draws most of the attention, but healthcare, financials, and utilities are also forecast for double-digit growth.
- The economy backs this up: 90,000 new jobs per month this year compares with just 10,000 last year, alongside 2% real GDP growth.
- The team also addressed a common question: are we in another AI bubble like the late 1990s dot-com run? Unlike the 1990s, when earnings growth for the leading companies was flat to declining, today's leaders are seeing accelerating earnings. That is a meaningful difference the team plans to revisit later in the Q&A.
Valuations: Why P/E Multiples Are Contracting
- Rising stock prices usually push valuations higher, but the opposite has happened this year. Price-to-earnings multiples have actually contracted through the first half of 2026.
- The reason: earnings are growing faster than prices are rising.
- Large caps trade around 20 times forward earnings. Mid and small caps trade at notably cheaper levels, a gap that has persisted for a while as large caps have justified their premiums with stronger earnings momentum.
- Trailing 12-month earnings have also accelerated across large, mid, and small caps since 2020, a sharp change from the post-financial-crisis period when earnings growth was closer to flat.
US Equity Strategy: Size and Style Performance
- Large growth stocks had another strong quarter, up 22% for the year and 26% over the past 12 months, which on the surface points to another mega-cap-driven market.
- But June told a different story: none of the Magnificent 7 stocks were up that month, while small and mid-cap stocks performed well.
- The Russell 2000 posted a 40.8% return, the largest number on the size and style table, both for the quarter and the trailing one-year period. That would surprise most investors still assuming this is purely a mega-cap, AI-driven market.
Market Breadth Is Widening
- Comparing the market-cap-weighted S&P 500 to its equal-weight version shows a long stretch where mega-cap stocks strongly outperformed, a fair criticism that the bull market's gains were narrow.
- In June, that changed. 72% of stocks in the S&P 1500 beat the index outright, and 78% of small-cap stocks beat the S&P 1500.
- July numbers came in a bit softer, with about 60% of stocks (and 60% of small caps) still beating the index, as large caps regained some relative footing. Still solidly above a 50-50 split.
- Broader participation is a healthy sign. It means gains are not limited to a handful of AI winners, and there is more room for stock selection to add value.
Small-Cap Rally: How Far Can It Go?
- The Russell 2000's strength this year raises a natural question: will small-cap outperformance continue, or is this another head fake after several false starts in recent years?
- On a rolling three-year basis, the window the team's process is built around, large caps still lead small caps by about 7%. But the trend line is moving back toward zero.
- The team is watching this closely but has not yet made a change to increase small and mid-cap exposure across portfolios.
Growth vs. Value: Momentum Still Favors Growth and the July Reversal
- On the real-time growth-versus-value indicator, the line still points toward growth, even as the rolling three-year size trend shifts.
- Momentum, meaning stocks with strong recent price trends tend to keep trending, has been an unusually powerful factor in 2026, largely fueled by AI enthusiasm.
- In July, that reversed hard. Momentum stocks fell 24% for the month, the sharpest drop since the financial crisis.
- In the team's view, this looks more like a rotation and some profit-taking that helped fuel the market's broadening, rather than a signal of a broader downturn. As always, that read could change as more data comes in.
How Burney's Investment Process Has Evolved
- Burney's process began more than 50 years ago as a small-value stock-picking strategy, one that worked well until the late 1990s, when a historic pro-large-cap year in 1998 was immediately followed by a historic pro-growth year in 1999.
- That stretch taught the team its most important long-term lesson: every factor exposure cuts both ways. Small, value, profitability, quality, and momentum all carry a long-term edge, but each will work against you for periods of time.
- That lesson led to today's dynamic size and style process, layered with a stock-level scoring model (SCORE) weighted toward profitability and quality, plus a separate momentum signal used for shorter-term decisions.
- After major market sell-offs, the team shifts to a Recovery Score model that looks for stocks that have been beaten down the most rather than stocks with strong momentum, since those dynamics flip during recovery periods.
- The process also incorporates a licensed third-party signal that flags companies likely to see positive or negative revenue and earnings surprises. It is the most expensive single input in the process. (Note: pending compliance confirmation on whether the vendor name AlphaDNA can be used in written marketing copy. If cleared, we can reinsert the name here.)
- All of these signals are blended into an internal alpha estimate, then run through a portfolio optimizer the team has used for 15 to 20 years to build portfolios that track intended size and style targets while maximizing that alpha estimate.
- This structured process lets the team look back on any period and identify exactly what worked and what did not. The team has pointed to momentum and the licensed earnings-surprise signal as notable contributors this year.
Q&A
Questions addressed in the Q&A session included:
- Is the stock market in an AI bubble?
- Aren't valuations stretched at this point?
- Are we due for a correction, and how should investors think about that risk?
- Aren't midterm election years historically bad for the market, and how is Burney positioning portfolios for it?
- What's the outlook on inflation and oil prices given the conflict in Iran?
- What are the strengths and weaknesses of the US and global economies over the next 6 to 12 months?
- Will international stocks continue to outperform, or will the US regain its lead, and how should investors think about international allocation?
- How does Burney handle dividends in client portfolios?
- Can you provide an update on the BRES ETF?
If you have questions like these or wish to discuss your financial planning needs, Schedule a Meeting with us.
Past performance is not a guarantee of future results. Indices are not available for direct investment. This presentation is for informational purposes only and does not constitute investment advice. Burney Wealth Management is a registered investment advisor. SEC registration does not constitute an endorsement of the firm by the Commission nor does it indicate that the advisor has attained a particular level of skill or ability.
The Burney Company is an SEC-registered investment adviser. Burney Wealth Management is a division of the Burney Company. Registration with the SEC or any state securities authority does not imply that Burney Company or any of its principals or employees possesses a particular level of skill or training in the investment advisory business or any other business. Burney Company does not provide legal, tax, or accounting advice, but offers it through third parties. Before making any financial decisions, clients should consult their legal and/or tax advisors.

