


A team to guide you
Our team of advisors guide you through various retirement scenarios, quantify your goals and plan for life’s uncertainties before crafting a retirement plan that aligns with the future you envision.


We update this resource on a regular basis to stay up to date.
We believe that watching the day-to-day gyrations of the stock market is more likely to drive you mad than to help. Over the long run, the stock market is an incredible money-making machine, but it is not as obvious from one day to the next. If you'd like to talk to a financial advisor about your long-term investment strategy, drop us a line.
What happened in the stock market - April 2024
After five straight months of positive stock market performance, we were probably due for a negative month as the broad stock market finished April down 4.4%. The pullback was widespread with everything from growth to value, large to small selling off in a fairly tight range.
In our last edition of this blog series, we talked about the primary reason for the pullback – inflation and the expectation that the Fed will delay rate cuts. The data this month backs up that assertion. Stocks exhibiting high correlation with interest rates held up well while stocks that show little or negative correlation to rates fell more as the 10-year rate rose from 4.27% to nearly 4.71%.
The market is pricing in higher rates for longer and that is having a negative impact on stocks that were looking forward to falling interest rates. This pullback could represent a good buying opportunity for patient investors, however. An analysis by Bespoke Investment Group shows that stocks are usually positive after long stock market winning streaks are snapped.
And while it seems progress on disinflation has slowed, there is reason to think the inflation picture will improve. While inflation in the 3-4% range is still too high for the Fed, it is not rising at crisis levels like it was back in 2022 when inflation peaked around 9%.
Additionally, the slightly hotter than expected numbers seen in April are due to factors that shouldn’t persist. Specifically, the areas that saw the largest increases – consumer electronics, financial services, and healthcare services – were largely due to temporary factors per Goldman Sachs Economics Research. Goldman is predicting that core PCE inflation falls to a 2.2% annualized pace the rest of the year and is predicting two rate cuts this year, one in July and one in November.
Like rate sensitivity, another factor that was effective last month was momentum, specifically on the bear side. We measure momentum in two ways. First, we simply look at the performance of all stocks over the past six months and isolate the bottom 10th percentile. We call these stocks “eyesores” due to their poor performance and, in normal markets, they tend to continue underperforming. That was the case in April as this group of stocks lost 8.1% compared to 5.5%.
The other way we measure momentum is by using a combination of long-, mid-, and short-term moving average signals to determine bullish and bearish patterns. Here, the bearish group did even worse than the eyesore group, losing 11.5% as a group.
Opportunistic investors looking for a dip in the market to add more money may have found it in April. Moving forward, it will be important to understand how your holdings should fare when interest rates change and monitor your holdings’ price momentum. We would be happy to run a portfolio analysis for you to help you understand how your portfolio is positioned to take advantage of the current market. Reach out to set up this complimentary analysis.

What happened in the stock market - April 11, 2024
The stock market is back to being near all-time highs from the inflation-fueled bear market as the news on inflation has largely gotten better, so it is easy to forget how closely the market was watching inflation back in 2022. In October of that year, we wrote this in our quarterly letter to clients:
The third quarter was a roller coaster ride for the stock market. Given the selloff to end September, it is easy to forget the S&P 500 was up 12.5% for the quarter on August 16th. The reason for the rally was economic data suggesting inflation was beginning to cool, but from August 16th to the end of the quarter, the S&P 500 fell 16.9%. The reason? Inflation coming in hotter than expected. The theme here is the stock market is watching inflation closely and inflation surprises high or low will likely drive financial markets until it is tamed.
Yesterday, The US Bureau of Labor Statistics released its monthly CPI inflation report that showed prices rising slightly higher than expected with the 12-month inflation rate at 3.5% vs the expectation of 3.4%. The stock market reacted as you would expect with all major indexes declining, but the amount of decline wasn’t uniform. The large-cap S&P 500 index was down less than 1% - a bad day but hardly anything out of the ordinary – while the small-cap Russell 2000 fell by 2.5% - a much sharper selloff.
While inflation is still an important data point, its impact seems to have changed. In 2022, the entire direction of the market was driven by inflation. Today, the reaction from the largest stocks seems relatively muted while smaller companies are still rewarded and punished by inflation surprises.
Small-cap companies typically rebound faster than large companies during stock market recoveries, but that has not been the cash this time. The price level of the S&P 500 is 8% higher than it was when the bear market started at the beginning of 2022, but the Russell 2000 is still 10% lower.
There are a couple of reasons why inflation is a bigger deal for smaller companies. The Federal Reserve reacted to this inflationary episode by rapidly increasing interest rates. The Fed has a dual mandate to maximize employment while keeping prices stable and the primary tool in its toolkit to stimulate or restrict the economy is interest rates. Higher rates are necessary to combat inflation, but higher rates come with a cost. Borrowing costs are higher now than they were a few years ago and many firms had gotten used to cheap access to capital.
Small companies are more likely than large companies to have floating rate debt, so the relative underperformance of smaller companies is in part explained by the cost of debt eating into earnings.
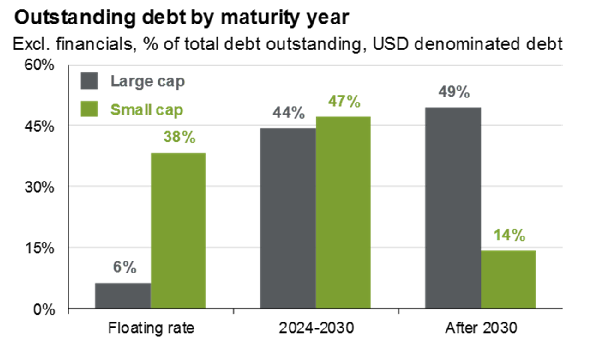
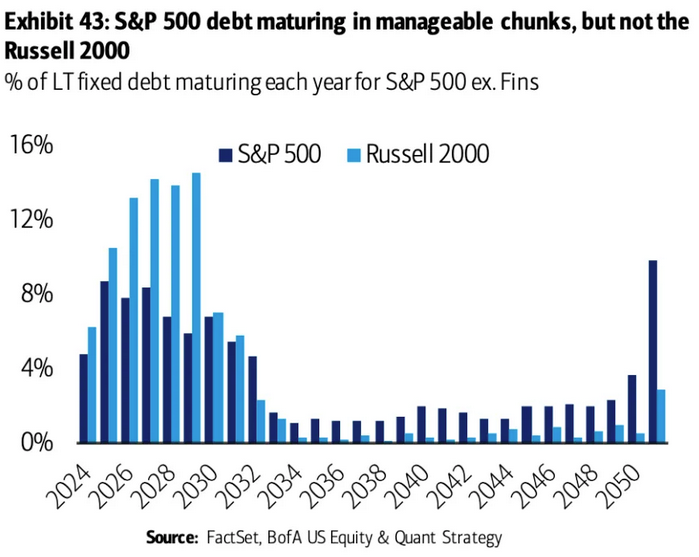
But maybe even more importantly, smaller companies have an impending wall of debt coming due in the next few years. The path of inflation is very important for these companies as it will impact where the Fed sets interest rates when this debt needs to be reissued. There is a big difference between 5% vs 4% vs 3% interest rates when it comes to valuing the companies in this boat.
So expect more volatility from small-cap stocks both up and down as inflation data comes in over the next few months and years. Allocating to small-caps could pay off if the Fed wins the battle against inflation, or it could continue to frustrate investors if inflation stays persistently above the 2% target.
What happened in the stock market - February 2024
While recent inflation reports have come in slightly higher than expected, stocks continue to perform well this year. The storyline in 2023 was the narrow performance of just a handful of megacap stocks but returns have been shared much more broadly over the past three months. Gains are being seen across all size, style, and economic sectors.
Coming into the year, we made three stock market predictions:
- Growth stocks will outperform Value stocks
- Small-caps will outperform Large-caps
- There will be above average opportunity to add value through stock selection
Here is how these predictions are shaking out.
Growth Momentum Strengthening
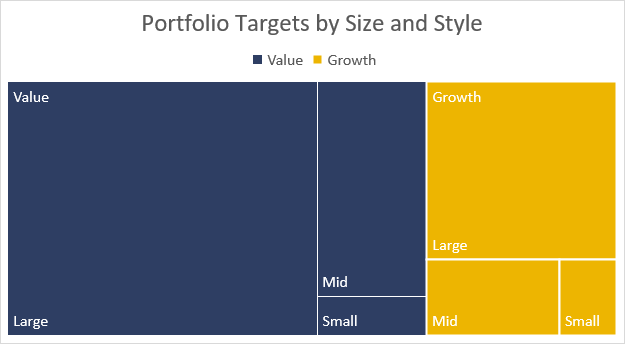
A shift from a pro-Value to pro-Growth phase began last year and Growth stock momentum is picking up. As a reminder, Value stocks are typically characterized by being undervalued relative to their intrinsic worth, often with low price-to-earnings ratios and high dividend yields, while growth stocks are companies expected to have above-average growth rates in revenue and earnings, often reinvesting profits for expansion rather than distributing dividends, and tend to have higher price-to-earnings ratios reflecting investor optimism about their future prospects.
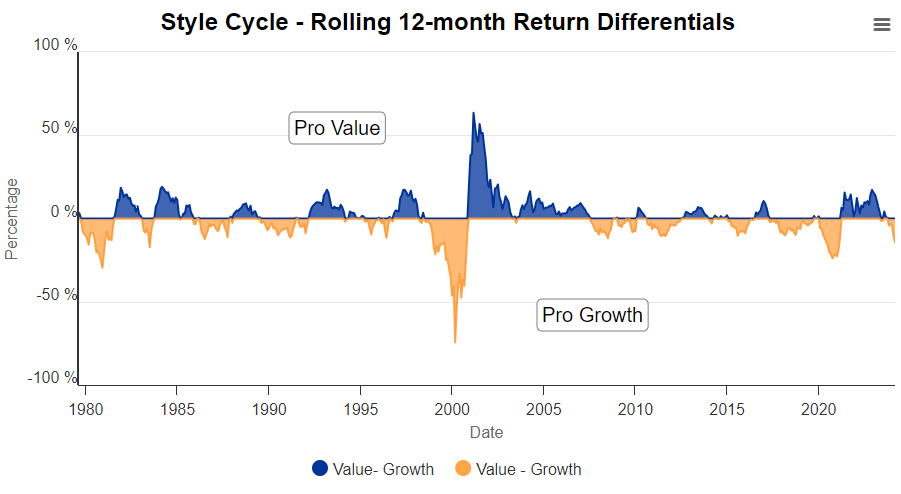
Growth stocks held a substantial edge each month of the new year outperforming Value by 2.7% in January and 4.7% in February. We roll return differentials between Growth and Value stocks over a one-year time frame to show these Growth and Value phases. The line is now pointing clearly towards Growth and we expect this momentum to continue. The typical Growth phase lasts between 18-24 months, so there is still plenty of time to position portfolios towards Growth.
So far, this prediction that Growth will outperform Value is playing out as expected.
Small Caps Look Cheap, but Large Caps Keep Performing
Small-cap stocks outperformed large-cap stocks by an astounding 8.3% in December and the historical pattern in Size cycles implied that small companies were poised to break out in 2024. So far, that has not been the case, however, as large cap stocks rose by 7.1% and small caps only 1.5% through the end of February.
Large cap stocks refer to companies with a large market capitalization, typically exceeding $10 billion, representing established and well-known companies with stable operations, while small cap stocks represent companies with a smaller market capitalization, typically below $2 billion, often characterized by higher growth potential but also higher risk due to their smaller size and less established presence in the market.
The Fed’s battle to tame inflation seems to be affecting small-cap stocks more than large-cap stocks as small caps are more likely to have floating rate debt, which gets expensive as interest rates rise, and is more likely to have debt maturing in the coming years. This creates something of a wall that will make access to capital pricier for small companies if rates stay elevated.

Smaller companies are trading at less expensive forward price multiples compared to large companies, but valuations alone do not have a strong track record for predicting the timing of stock market phases. The lower valuations could imply that these companies are undervalued or it could simply reflect the reality that small cap companies will be less valuable in the future if access to capital remains so expensive.
While we still believe small-cap companies will eventually outperform, we need to see short-term momentum pointing in their direction before increasing our confidence in this prediction.
Stock Selection is Key
We’ve written in the past about how the opportunity to differentiate through stock selection increases when the stock market faces a major selloff and that has been the case in the recovery from 2022’s bear market. We evaluate how well our stock selection models perform by comparing the group of stocks in our bullish tails against the stocks in our bearish tails. Over the past one year, the group of stocks we rate as buyable outperformed the group in the sell bucket by 14.4%, well above our historical effectiveness.
The intriguing thing about this stock market recovery is that the types of stocks doing best aren’t the ones we’d expect. We turn on a special model during stock market recoveries that is trained solely on post-sell off rallies. Typically, the kinds of stocks that this model recommends buying are the most beaten down stocks that have perhaps been oversold. Historically, these stocks bounce back the strongest when the stock market recovery kicks off.
In practice, we take our standard model that leans into higher quality companies – that is companies with strong fundamentals, such as consistent earnings growth, healthy balance sheets, high profitability, strong competitive advantages, and competent management teams - and blend it with this “recovery” model to balance quality and recovery potential. It is normal for our standard model to show inverted effectiveness during stock market recoveries – meaning the bear tail outperforms the bull tail – and the recovery model to be highly effective.
This time, that pattern has been flipped as the standard model is outperforming the recovery model. An explanation for this anomaly is that this recovery has been less “V” shaped but rather marked by periodic selloffs and rallies. This market dynamic caused our recovery model to see whipsawed effectiveness that favored higher quality stocks. There is value in looking for oversold positions but overlaying that search with a focus on quality is proving to be prudent.
As the stock market rally has broadened beyond the magnificent seven, there has been more opportunity find stocks delivering strong performance.
What happened in the stock market - December 2023
Santa delivered a strong end to the year as stocks rallied towards all-time highs to cap off a banner year of investing. You could be forgiven if you didn’t enter 2023 with optimism, though. The S&P 500 had declined by 18% in the last year. Inflation was at 6.5%. Economists were talking about when not if the recession would start. It seemed the bear market was destined to continue. And if you had a crystal ball into the events that would transpire in 2023, you would think your pessimism was proven right. The Fed’s aggressive rate hikes caused multiple banks to fail. Geopolitical tensions, already front of mind with the war in Ukraine, sparked again in the Middle East. 10-year Treasury yields surged.
But December’s strong month pushed all major US indexes above double digit returns for the year. While the dominant story in the stock market for much of the year was the performance of the ‘Magnificent Seven’ stocks, we’ve seen better breadth in the market recently as small-cap stocks rallied strongly. It is often the case that small-caps do better than large-caps during stock market recoveries but that has not been the case in 2023, so this small-cap rally is welcomed.
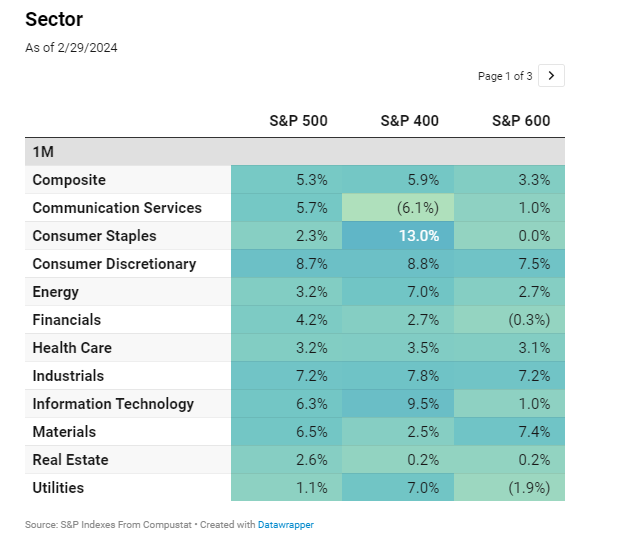
Another sign of increased market breadth is that gains in December were achieved across all sectors, with the exception of Energy. Everything from Staples to Tech, Materials to Communications did well.
More breadth means a broader set of stocks are achieving gains. This creates a more sustainable rally as the stock market isn’t overly reliant on a small number of stocks and it also creates the potential to add value from stock selection.
Moving forward, we expect small-cap momentum to continue. Both our long-term and short-term momentum models are pointing towards a sustained small-cap market phase. The typical size phase in the stock market is measured in years, not months, so there is time to take advantage. Many investors have profited off of the ‘Magnificent Seven’ over the past year but this may be a good time to take those gains and rebalance into smaller names.
What happened in the stock market - November 2023
The main storyline of the stock market in 2023 has been the domination of only the very largest stocks in the US. The stats are wild:
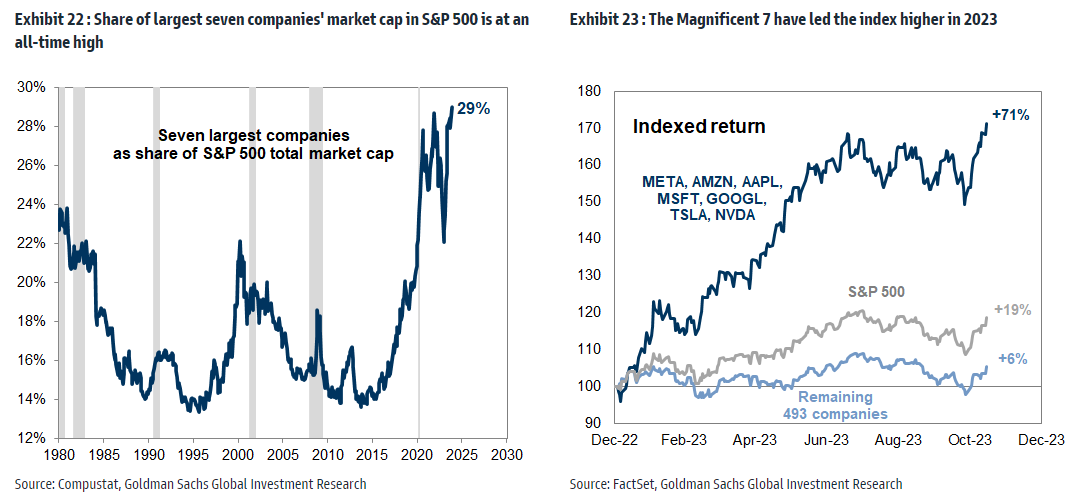
- The magnificent seven stocks – Apple, Alphabet, Microsoft, Amazon, Meta, Tesla, and Nvidia – make up nearly 30% of the market cap of the S&P 500
- Through the middle of November, these magnificent seven stocks rose 71% while the rest of the S&P 500 rose just 6%
- There was as high as a 15% difference this year between the market-cap weighted S&P 500, which gives the largest stocks more pull in the index, vs the equal-cap weighted S&P 500 that gives each stock the same weight.
The return of these large stocks makes the US stock market look strong at first glance but under the hood, things look different. Mid-caps were down 2% through the end of October and small caps were down even more at -5.5%. This lack of market breadth has been pointed to by some analysts as a sign that conditions aren’t as rosy as they appear in the stock market.
So, it was a good sign that returns in November were much broader. Growth or value, large-caps or small-caps, returns approached double digits for the month. It wasn’t just a narrow sliver of stocks enjoying gains, it was all types of stocks.
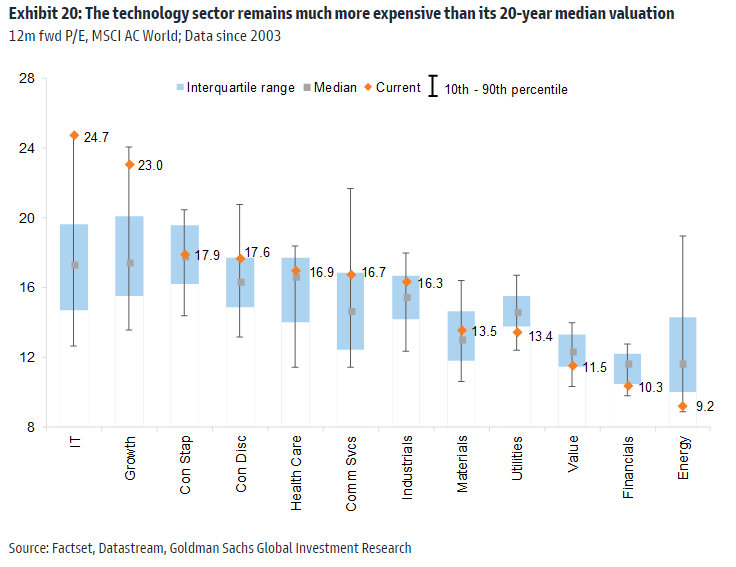
It is good that a wider range of stocks are making gains because it might be hard for the magnificent seven to continue driving stock market returns as valuations in the tech sector are much higher than the rest of the stock market.
The next wave of returns may have to come from smaller companies across different sectors. These stocks sold off more in 2022 but haven’t bounced back as strongly as large caps in 2023. This could create an opportunity for investors who feared they missed out on 2023’s stock market recovery as there are still attractive looking investments beyond the magnificent seven.
With the expectations of interest rates leveling off and inflation continuing to cool, it seems more and more likely that the Fed will pull off its “soft landing.” If this economic Goldilocks period of strong growth and lower inflation continues, there would likely be an opportunity for small-caps to catch up.
What happened in the stock market - July 2023
One of the defining storylines over the past decade has been the increase in market concentration at the very top of the stock market. The largest companies have been getting bigger at a faster rate than the rest of the market. Apple was the first company to close with a $3 trillion market cap in June and Microsoft, Amazon, NVIDIA, and Alphabet (parent company of Google) are also in the $1 trillion+ club.
While Goldman Sachs finds that the size of the five largest companies in the S&P 500 averages 14% of the total index, the five companies listed above account for over 22% today.
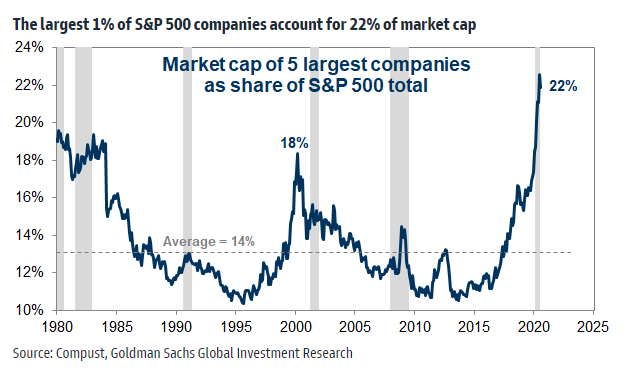
The implication for investors of this concentration is that the largest stocks have an outsized pull on stock market returns as most indexes are weighted by the size of the companies in the index. Earlier this year, that outsized pull was even more extreme as the top stocks in the S&P 500 accounted for nearly all the stock market returns.
In the spring, uncertainty reigned as the health of regional banks was in question following the failure of Silicon Valley Bank and a showdown over the debt ceiling was looming. At first glance, it seemed like the S&P 500 was taking the uncertainty in stride as the headline S&P 500 performance number was +5.8%. That obscured what was happening underneath the surface, however, as the returns were driven by the largest stocks. Apple was up 20%, Microsoft 32%, Alphabet and Amazon 35%, and NVDA 75%.
As mentioned earlier, the typical weighting of the S&P 500 is by market cap, but there is a different version of the index that gives all stocks the same weight. That version was down 4.3%, showing that the typical stock in the S&P 500 had lost money. Yes, the S&P 500 was both up 5.8% and down 4.3% at the same time.
But this uncertainty largely resolved itself by the end of May and the trend favoring mega caps reversed. Participation in stock market returns has been much more widespread. In the months of June and July, the equal weight version of the S&P 500 (+11.4%) was ahead of the market-cap weight version (+10.0%).
While stock market concentration naturally ebbs and flows, the above average returns for the largest companies has been unusual. Market-cap weighted indexes will look particularly good when the very largest companies see such strong performance, but it is challenging for large-cap stocks to keep delivering these results. More breadth in the stock market means more opportunity to make money beyond the big names and increases the importance of stock selection.
What happened in the stock market - May 2023
Exit Uncertainty, Enter Summer?
If there is one thing the market hates, it’s uncertainty and there has been lots of that recently.
Inflation.
Regional bank failures.
Debt ceiling.
Apart from a handful of mega cap stocks, this uncertainty caused the market to barely tread water over the past few months from March to May. While the market-cap weighted version of the S&P 500 was positive, the equal weight version fell by 4% and small cap stocks did even worse as the Russell 2000 was down 7%.
It can be easy to forget that prior to March, the market was rebounding strongly. From the start of the fourth quarter 2022 to the end of February, stocks rebounded by double digits with the S&P 500 up 12% and the Russell 2000 up 15%. The one primary source of uncertainty – inflation – was largely improving and there was little else to concern the market.
The shocking failure of Silicon Valley Bank in early March marked a turning point as investors suddenly worried about the stability of the banking sector. How could a bank as large as SVB fail? How many other banks were in trouble? What unforeseen effects would this have on financial markets and the economy?
Around the same time, rhetoric around the debt ceiling was reaching a boiling point and would only get worse. On one hand, it was unthinkable that the US would ever voluntarily default on its debt. Such a move would have dire consequences globally as US Treasuries are the bedrock of the global financial system. But partisanship in Washington is so high that there was legitimate doubt such a deal would get done.
By the beginning of May, conditions felt especially ominous as First Republic Bank was finally put out of its misery, acquired by JPMorgan. Though it was obvious it was only a matter of time before First Republic would be bailed out, this announcement sparked yet another selloff from regional banking stocks. This fear proved to be short-lived, however, as regional banks recovered from the May dip and have since rallied nearly 24% from the May lows1. A quick Google search reveals remarkably few articles written on regional banks since early May and Google trends show search interest has waned back to normal levels. As a source of uncertainty, it seems the market has scratched this as a storyline.
Regional Banks
The concern baton was passed from regional banking stocks to the debt ceiling as the so called “X-date” of when the US would run out of money to pay debts was fast approaching. But as we now know, President Biden and Speaker McCarthy struck a deal over Memorial Day weekend and the deal saw bipartisan support as it quickly passed the House and Senate. Almost overnight, the debt ceiling went from major source of uncertainty to crisis averted.
Debt ceiling.
Today, we seem to be back to where we were before the SVB crisis. The only remaining source of major uncertainty is inflation and the news has remained largely positive. The term “soft landing” is gaining popularity in Google searches again and the market is back to favoring high beta stocks. Risk on.
Many investors with cash on the sidelines were waiting for these uncertainties to resolve themselves. Now that they have, we may be looking at the return of the October 2022 to February 2023 recovery. Making short-term calls in the stock market is infamously a fool’s errand, but if you were one of those investors with cash on the sidelines, now is a great time to put that money to work as we enter what appears to be rosier conditions this summer.
Reach out today to see how we can help optimize your investments to achieve your goals.
1 Proxied by the SPDR S&P Regional Banking ETF (KRE) from 5/5/2023 to 6/7/2023
What happened in the stock market - April 2023
The 2010s saw an unusually strong period of growth stock outperformance, a trend that was magnified in the aftermath of COVID-19 as the world shifted online overnight. Goldman Sachs Asset Management points out that growth tends to do better in a period of low economic growth, low inflation, and low interest rates. During the 2010s, these were the conditions that characterized much of the global economy, and as a result, growth stocks outperformed value stocks.
Growth stocks are typically companies that are growing their earnings faster than the overall market, and investors are willing to pay a premium for this growth. In contrast, value stocks are companies that are trading at a discount to their intrinsic value and are often seen as undervalued by the market.
The COVID-19 pandemic marked a turning point for the global economy, as businesses and consumers were forced to adapt to a new way of life virtually overnight. This shift to online shopping, remote work, and digital communication benefited many growth companies, such as technology firms and e-commerce giants. As a result, the growth phase that had already been in place during the 2010s was magnified, and growth stocks continued to outperform value stocks.
However, in early 2021, this growth phase abruptly ended. The global economy began to recover from the pandemic, and inflation began to rise as supply chain disruptions and labor shortages caused prices to increase. At the same time, interest rates began to rise as central banks shifted from stimulating their economies to fighting inflation. These conditions favored value stocks and the price of many of the growth stocks that surged in the COVID aftermath came crashing back to Earth.
The stock market moves in a cyclical pattern between pro-Value and pro-Growth cycles that last 22 months on average. This trend can be clearly seen when we compare the performance of Value and Growth stocks over rolling one-year time periods.
During pro-Value cycles, Value stocks outperform Growth stocks as investors seek out undervalued companies. In contrast, during pro-Growth cycles, Growth stocks outperform Value stocks as investors are willing to pay a premium for companies that are growing their earnings faster than the overall market.
We anticipated this most recent pro-Value market phase and were positioned in portfolios to take advantage. However, the current phase has lasted 26 months, which is already longer than average, and the last strong pro-Value month occurred in January with Growth gaining momentum over the past several months.
Given the length of this Value phase and the short-term pro-Growth momentum, we are coming off our full value bet and shifting allocations towards growth. This is not to say that we are abandoning value stocks altogether, as we would like to see a little more data confirming this shift in the market cycle. However, we believe now is a good time to maintain a balance between growth and value as we may be shifting from a pro-Value to a pro-Growth market regime.
What happened in the stock market - March 2023
A relatively calm start to the year was disrupted by chatter in early March that Silicon Valley Bank, the bank for Silicon Valley startups, was in trouble. On Wednesday, March 8th the bank announced it needed to shore up its balance sheet and raise $2 billion in capital. This announcement spooked high profile venture capital investors who began urging their portfolio companies to withdraw money from SVB.
The next day, SVB stock fell by 60% as panic spread throughout social media and in group texts amongst the tight knit venture capital community.
Then, suddenly, on Friday, March 10th the bank failed, and the FDIC took over.

At the time, there was mass confusion and shock as it felt unthinkable that the 16th largest bank in the United States could fail. People and companies who had deposited their cash at SVB had no way of knowing if or when they would ever see that money again. Fear of contagion to other banks was widespread – headlines of a bank failure make it pretty easy for people to imagine 2008 all over again. Volatility spiked and remained elevated through much of the month.
Surprisingly, while the stock market did wobble, it never really lost ground for any extended amount of time. In a mind bending bad-news-is-actually-good-news sense, expectations for a Fed pivot from interest rate hikes to cuts caused stocks to advance with large-caps and growth stocks leading the way. Rate cuts are a relatively good thing for growth companies as lower rates make capital easier to access and the math works better on expensive valuation ratios.
Despite the Fed’s own predictions that rates will not be slashed before the end of the year, the market seemed to take the position that the Fed will only raise interest rates until it breaks something and SVB was the thing the Fed broke. With inflation more under control, lagged effects from past hikes still rippling through the economy, and the likelihood of more restrictive lending standards from banks, the thinking was the Fed will need to cut rates to avoid harming the economy too much.
In the chaos, there was also a flight to safety. While the S&P 500 rose by 3.7%, the highest beta stocks – that is, the stocks most sensitive to market returns – within the S&P 500 fell by 1.1% per the High Beta ETF SPHB. Small-caps slid even further by 4.8%. When uncertainty spikes, such “risk-on” investments tend to struggle.
While it is too early for the all-clear signal, there is more clarity into the regional banking crisis. The banks that were most in distress either made bad bets on crypto (Signature and Silvergate), were already troubled (Credit Suisse), or uniquely prone to a bank run (SVB). The FDIC/Fed/Treasury response and lack of evidence of widespread banking issues put most concerns about contagion at bay. The stock market seems to be in a healthier spot now than was feared on March 10th.
What happened in the stock market - February 2023
This section of our website is a running post we update monthly. It is something of a tick-tock (no, not the app) of the current events having an impact on the stock market. In November, we wrote the following:
We often like to say there are two or three things worrying the stock market at any given time, but right now those things seem to be, in order:
- Inflation
- Inflation
- Inflation
Everything else seems to be a distraction.
And so far, that observation seems prescient.
Stocks rallied in January as the key inflation indicator, the CPI, came in below expectations. There were quotes in publications like CNBC optimistic about the inflation outlook:
- “Inflation is on its back heels.”
- “I don’t think people will be talking about inflation this time next year.”
- “It just feels like, across the board, inflation is cooling off here very quickly.”
And, sure, the lower than expected inflation data matched up with the story over the second half of the year that the Fed’s efforts to combat inflation were working. It was generally expected that just one or two small rate hikes were left before the Fed would at least pause for the time being.

Fast forward one month and, based on the headlines, you would guess inflation was as bad as it’s ever been. The data from January showed that inflation was more persistent than expected, especially core inflation. Headlines referenced inflation’s “alarming staying power,” “worrying details,” and “stubbornness.”
The stock market fell for the month, bond yields rose, and, suddenly, expectations for the Fed’s future path of rate hikes changed.
So, what should we make of the economic conditions? Talking heads on TV and in publications will wildly swing predictions between a soft or hard landing, recession or not. Is the inverted yield curve signaling a recession? Is it signaling lower long-term inflation expectations? Why is the unemployment rate so low?
The data is confusing and the Fed’s battle with inflation is uncertain. The honest answer is no one knows whether or not the US economy will enter a recession, when inflation will be back to the Fed’s target, or how financial markets will react as this all plays out. And, as investors, it is all outside of our control.
Stocks are still in the green for the year, a welcome improvement over last year, and the silver lining of higher interest rates is higher income from fixed income investments in the future. Additionally, the recent stock market volatility implies higher expected returns from stocks.
If you already have a carefully selected mix of asset classes in your portfolio and you are confident in your financial plan, there really isn’t much to do. If you are concerned that you might be making some missteps in your portfolio, reach out today to get a customized portfolio analysis from a Burney Wealth Advisor.
What happened in the stock market - January 2023
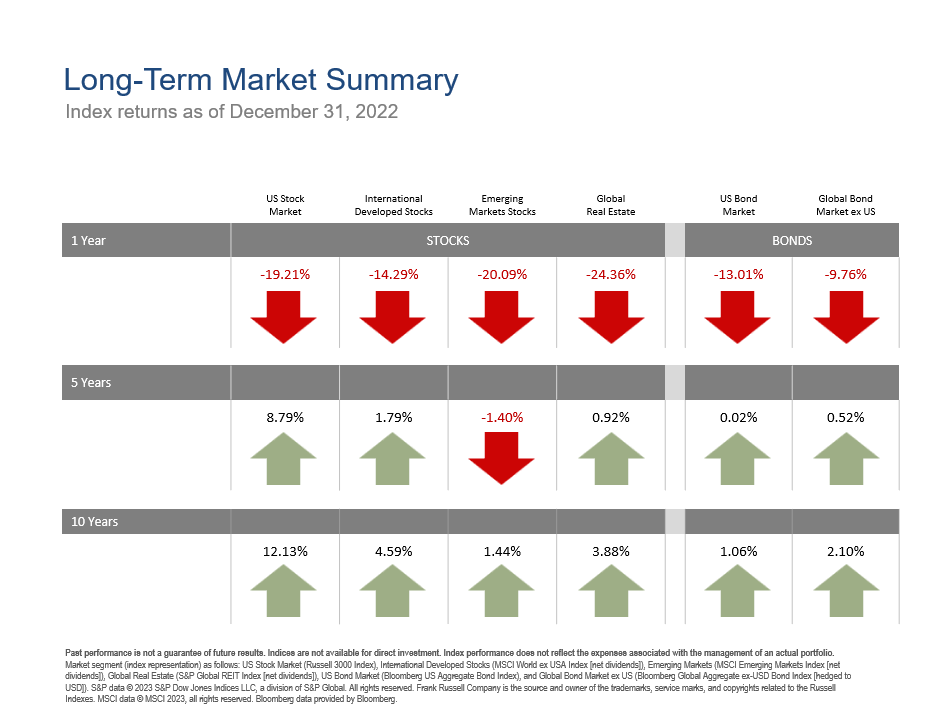
Investors everywhere were happy to turn the page on 2022 and financial markets did not disappoint in January. Coming off a year in which the S&P 500 finished down 18.2% and the aggregate bond market finished down 13.0%, stocks advanced 6% and bonds by 3%. There is increasing, if cautious, optimism that this rally has legs as inflation is easing and the Fed is expected to soon stop its policy of raising interest rates.
One of the silver linings of major market selloffs is they tend to create opportunity to identify and take advantage of stocks that were oversold and have potential to bounce back. It turns out that the types of stocks that do well during stock market recoveries are remarkably predictable and can be modeled. In what could be perceived as a vote of confidence for stocks, Burney’s US equity strategies are leaning into what we call our “Recovery Score” stock selection model.
While the direction of the markets in 2023 changed vs 2022, some trends remain the same. Value companies held up significantly better than Growth companies during the bear market and that pro-Value momentum continued with Value stocks outperforming Growth stocks by 3.5% in January. This shouldn’t be surprising as we are firmly entrenched in a pro-Value market phase. As we covered in our 4th Quarter in Review webinar, there are multiple reasons to believe pro-Value momentum will continue:
- The typical Value phase is measured in years not months.
- Momentum tends to be self-fulfilling. A simple but effective rule of thumb is to expect whatever market phase we are in to continue.
- Relative valuations were historically stretched coming into 2022 and Value still appears cheap relative to Growth even after its strong relative performance.
We continue to tilt our portfolios towards Value.
One final note that might be surprising to some is that international stocks are showing signs of life. As US based investors, we are all prone to the “home bias.” That is, we are more comfortable investing in US stocks because we live here. This home bias is even more pronounced considering US stocks outperformed global stocks substantially over the past decade.
But a diversified portfolio should be invested globally and a global portfolio is outperforming a US domestic one recently. Last quarter, international developed stocks more than doubled the performance of US stocks and in January, overseas companies carried a two-percentage point edge. You could be forgiven if you’ve been ignoring international stocks in your portfolio, but it may be time to reconsider.
Here is the latest 'Where to Invest $10k" w/ your's truly providing some ETFs to play it. This is the first time all of the experts recommended the same thing. They all said international. Story via @WealthWatch https://t.co/ghQUENqwCJ via @wealth
— Eric Balchunas (@EricBalchunas) February 1, 2023
As we move into the second month of the new year, now is a great time to follow up on your portfolio’s performance. Is it performing to your expectations? Have there been any surprises over the last year? We are offering a personal portfolio analysis to identify areas of opportunity or improvements with your investment portfolio. Reach out today to set up this complimentary analysis.

What happened in the stock market - December 2022
Santa may have come early for the stock market as the so-called “Santa Rally” never materialized in December. The S&P 500 fell 6.1% in the month, though that decline was not enough to offset what turned out to be the strongest quarter of the year. In fact, it was the only positive quarter of 2022 at a 7.0% gain.
A major reason for December’s decline was Fed Chairman Jerome Powell’s comments reinforcing that the Fed remained committed to aggressively combatting inflation. A growing number of voices on Wall Street, like Professor Jeremy Siegel, have been calling for the Fed to pause rate hikes, arguing that the Fed’s actions have already been enough to combat inflation and that the Fed risks pushing rates too far and harming the economy. Stock prices had been advancing on the idea that the Fed may pivot earlier than expected but Powell gave no indication that they will pivot in the short-term.
While stocks fell across the board, the prospects of higher interest rates weighed on Growth companies more heavily than Value companies.

This has been a trend we’ve seen all year as Value stocks substantially outperformed Growth stocks in 2022. The headwinds for Growth are multifaceted. Expectations for Growth companies grew far too lofty in the aftermath of the pandemic and pandemic darling stocks, like Zoom and Peloton, have come crashing back to Earth. From a technical standpoint, the purchase of a share of a stock is a claim on the present value of the stream of future earnings. The math that discounts the future earnings to today is heavily influenced by the discount rate. Low interest rates could support high valuations but the rapid increase in rates this year necessitates a rerating of these dearly priced companies.
Furthermore, Growth companies entered the year historically overvalued relative to Value companies and even with the strong move towards Value, they remain expensive. While valuations are not a great timing mechanism, eventually, regression to the mean is a powerful force. When you couple the context around these relative valuations with the trend in the market favoring Value companies, we believe there is still time to take advantage of the current Value phase and are tilting our portfolios towards Value.
It's been a tough year in financial markets as seemingly everything from stocks to bonds saw declines. What makes the year tougher is that the types of investments that had been doing the best over the past couple of years tended to do the most poorly during this bear market. We are offering a personal portfolio analysis to evaluate your investment portfolio and help you stay ahead of risks and opportunities. Contact us today to set up this complimentary analysis.
What happened in the stock market - November 2022
We often like to say there are two or three things worrying the stock market at any given time, but right now those things seem to be, in order:
- Inflation
- Inflation
- Inflation
Everything else seems to be a distraction.
If you recall back to the summer, the stock market set lows with the Russell 3000 posting a 24% loss for the year in June once it became clear the inflation picture was worsening. Then, from the start of July until the middle of August, the Russell 3000 rallied nearly 15% on the back of a better-than-expected inflation report showing that inflation was cooling.
That inflation report proved to be fool’s gold, however, as the next couple of inflation readings showed that inflationary pressures were not easing and the market revisited those 24% lows. The bottom line is the data that appears to be causing the most movement in the market is the inflation data.

So far this quarter, the inflation reports have trended positive again and the market is rallying by double digits as a result. In fact, we are in a strange cycle where good news can be bad news as highlighted by the November jobs report showing a robust and resilient labor market, which was met by a drop in the stock market. The concern was that wage pressures would exasperate inflationary pressures, keeping inflation high and prompting the Fed to continue raising interest rates.
Where inflation goes from here is a mystery that will only be discovered in time. Is the inflation picture actually improving or are we due for another summer head fake?
But there is evidence this time, inflation is improving. Wharton School of Business professor Jeremy Siegel has been making the point that forward-looking inflation indicators show inflation abating and has been calling for the Fed to slow or stop their pace of rate hikes. He points out that the most recent jobs report was “nowhere near as hot…as that first headline print” and even makes the prediction that rate cuts could happen far sooner than anyone is anticipating.
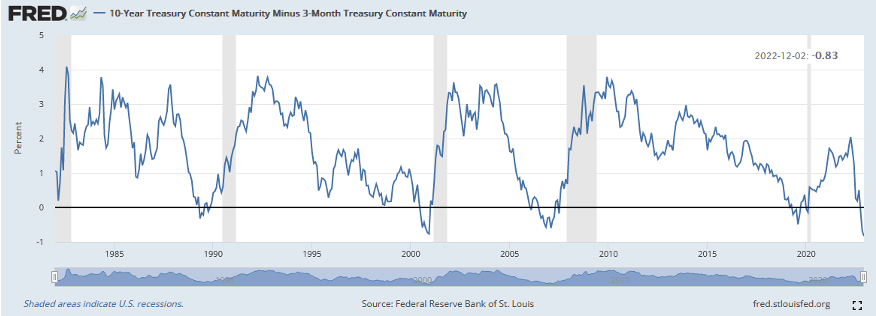
It is true that the yield curve, the difference between long-term and short-term interest rates, has been pushed to the point of inversion. In normal times, investors require more return for longer-term bonds reflecting greater risk of having their money invested over a longer time frame. But sometimes, like today, the relationship shifts, signaling the bond market’s view that longer-term rates will be lower than today’s rates. Some investors are pointing to the inverted yield curve as a sign the economy is headed for a recession, and they have good reason to interpret the yield curve inversion that way. Since 1950, an inverted yield curve has predicted every US recession with just one false signal.
But there is a different possible interpretation. The inflation we are seeing today could be caused by pandemic-related distortions that are in the process of sorting themselves out and the Fed may be able to rein in inflation without causing too much disruption to the labor market. The bond market is pricing in future interest rate cuts – the question is are the cuts going to be because the economy entered a recession or because the Fed successfully fought inflation?
What happened in the stock market - October 2022
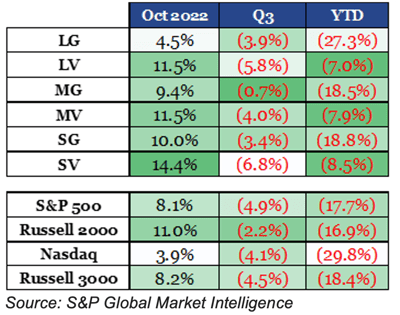 October saw a strong bounce back across equity markets, though the returns were not uniform. As has been the case all year, Value stocks saw the return edge over Growth stocks. This Value outperformance is being sustained for several reasons.
- Value came into the year historically undervalued relative to Growth
- Pro-Value momentum is well established
- Growth companies are more sensitive to rate hikes
Backwards looking indicators of inflation remain elevated and monetary policy has a lagged impact on the economy, but traders are now expecting just three more rate hikes before the Fed hits the pause button. Uncertainty and anxiety seems to have abated as volatility is down and stock market prognosticators are getting more optimistic about the direction of the market.
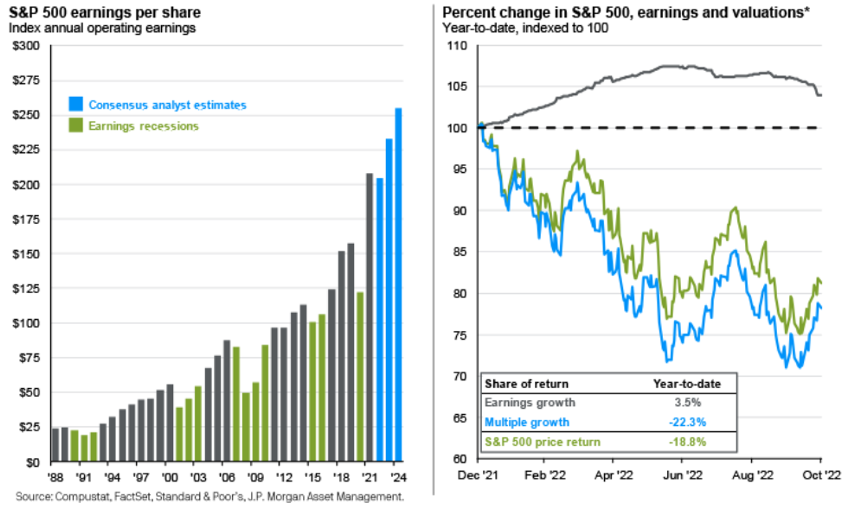
And there may be some fundamental reasons to be optimistic about stocks, too. Despite the pressure from the Fed, earnings remain strong at the aggregate level, supported by Energy, Materials, and Real Estate. The S&P 500 operating margin held up well in the third quarter at 11.9%. This strong earnings picture in the face of a broad year to date stock market decline means that price multiples have fallen, making stocks more attractive in the long term. The S&P 500’s forward PE of 16.7 is right at the 25-year average and earnings are expected to continue growing in 2023 and 2024.
If stocks do continue to march higher, it will make sense to take a step back from your portfolio and evaluate how your experience was during this bear market. Our experience this year is much more typical of a bear market than 2020, which was unusual in how quickly the market fell and recovered. Sometimes the worst part of a bear market isn’t the magnitude of the drop in prices but rather the length of time the market is in a drawdown. Now is a great time to think about following up on how your portfolio performed and how you handled it personally.
One of the biggest issues we are seeing industry wide and in talking with prospective clients is their traditional portfolios are not performing as promised. Many investors receive rule of thumb advice to simply invest 60% of their portfolio in stocks and 40% in bonds as this represents a moderate risk profile, with stock risk being offset by the supposed safety of bonds. During the past decade, this advice worked fine, but this asset mix has performed terribly in 2022.
If you find yourself disappointed in your portfolio’s performance this year, reach out to a Burney advisor for a personal portfolio analysis.
What happened in the stock market - September 2022
Since our last update, 2022 has resumed reminding investors of what investing in the stock market can feel like, with a continuation of the selloff that began the year and of the decline of some of the more favored investments of 2021 like the ARK Innovation ETF. These trends can prompt questions for investors such as: What does this selloff mean for my portfolio? How will this downturn impact my ability to reach my financial goals? Will I have enough money now to retire on schedule? Feeling this uncertainty is only natural and driven by our behavioral biases and the financial media’s play on them, it can often lead to poor financial decisions. However, drawing support from data and a shift in mindset can guide investors through uneasy market periods like this year and help them stay the course.
Investing during a selloff is hard. Every day of stock market declines brings on a fresh bout of nervousness driven by investors’ behavioral biases. Loss aversion, or the cognitive bias that makes them feel twice as much pain from losses as they do joy from gains, makes them tune in more to what is happening in the market during selloffs than they otherwise would during good times. What’s more, the financial media, motivated by generating clicks and playing on their negativity bias, or their amplified emotional response to negative events compared to their emotional response to similar positive events, bombards them with headlines describing stocks sliding due to one factor or another. This moves investors to check their portfolios likely more than they should and creates an environment where they feel compelled to act by either making wholesale changes to their exposure to stocks or going to cash, both of which can have negative impacts on their portfolio returns and ability to hit their financial goals.
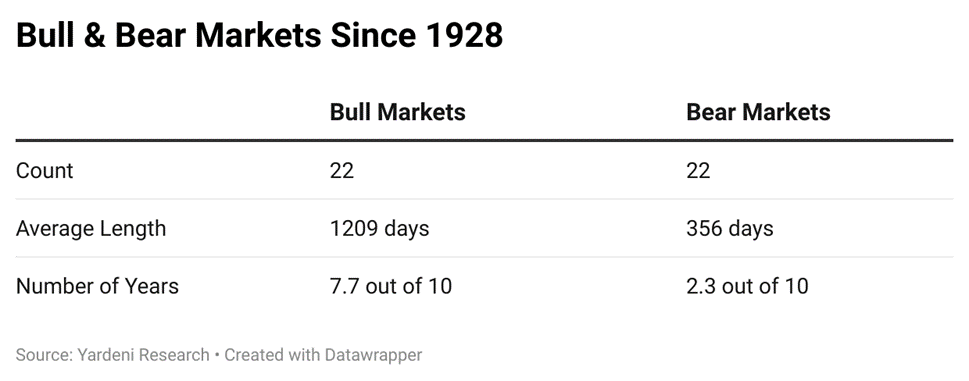
So what should investors do in times like these? Relying on data to guide financial decisions can be effective tools for managing the uncertainties that come with investing in a selloff. While it can often feel during these periods that stocks will be in a freefall forever and that investors are doomed to suffer through a bear market for the foreseeable future, this is typically far from the truth. Stock market selloffs, although a regular and healthy feature of the stock market, are not the typical market environment investors are subject to. Going back to 1928 there have been an equivalent 22 bull and bear markets and importantly, the bull markets have lasted longer, with the average bull market lasting 1,209 days compared to the average bear market lasting 356 days. This means that an investor is 3.4 times more likely to be investing in a bull market than a bear market and will be investing in a bull market in 7.7 out of every 10 years of their investing lifetime. A clear winner in favor of the good times.
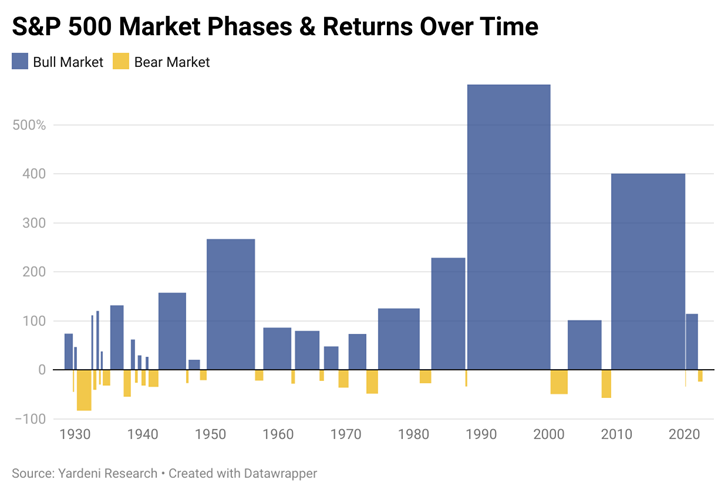
Bull and bear market count and length is one thing, but what about returns? Here again the data gives us reason to rejoice. Not only is the average bull market longer than the average bear market, but its returns are also much more positive than the average bear market returns are negative, with an average bull market return of 133.1% compared to an average bear market return of -36.6%.

At a factor of 3.6 to 1, the positive returns of bull markets more than compensate investors for the extra pain from losses they must endure during bear markets. This additional return together with the relatively longer length of bull markets compared to bear markets paints the true, much more positive picture of what the experience of investing in the stock market has been like over time.
The data shows investors what has happened in the past and can inform them of what will potentially happen on average, however they can still be left wondering what to expect going forward specifically during the current selloff. Looking for answers from the financial media or economic forecasts is often a losing strategy, but what investors can do is notice that after every bear market since 1928 stocks have at some point reached new all-time highs again and based on this fact, they can adopt a mindset of considering the positive returns that would need to happen at each lower market level for the market to recover to new highs. Viewing declines through this lens, any additional amount of decline provides investors with the opportunity to capture the even greater positive returns needed to get back to new highs, or a concept that is more commonly described as now being “a good time to buy”.
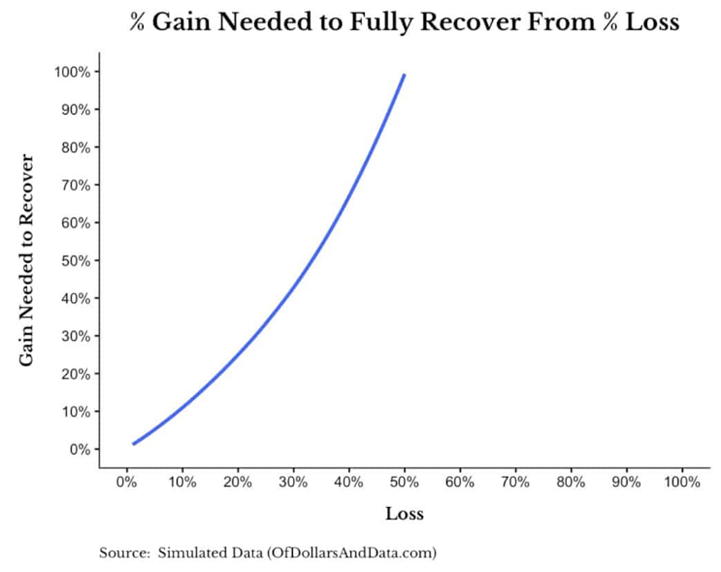
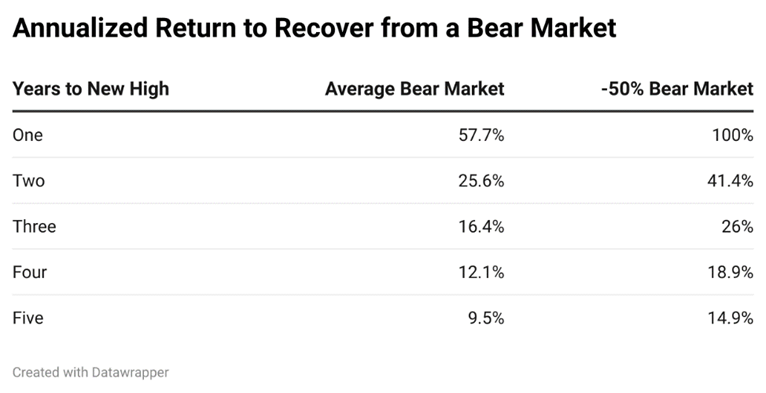
Adopting this buyer’s mindset can be challenging due to the factors we’ve acknowledged already but fortunately reframing the upside can help. The key here is to ask yourself how long you think it will take for the market to recover and based on your answer to that question, to back into the returns needed to reach new highs over that time horizon. Using the average bear market decline of -36.6% and an even worse scenario of a -50% decline, the annualized returns needed to recover from a bear market can be particularly attractive and even when stretching the recovery out over five years, can be almost no worse than the 10% long-term average return of the stock market.
This reframing of the question to focus on what would need to happen going forward can provide investors with the confidence to stick with their investment strategy.
All data and mental frameworks considered, investing during a selloff is hard and there is not a one-size-fits-all strategy for dealing with these periods. Understanding the loss aversion behind their negative emotions, recognizing the financial media’s play on their negativity bias, and relying on data and reframing the upside, among other approaches (1) (2), can be effective tools for helping investors manage the difficulties of investing during a selloff. And sometimes, something as simple as talking through concerns with your advisor can be the right solution. If you are feeling nervous, reach out to us. We are here to listen and help guide you through all market environments, both good and bad.
What Happened in the Stock Market 10/2018?
Stocks sell off.
It is an inevitable, even healthy feature of stock markets. Yesterday, the previously high-flying NASDAQ led the market lower, falling by 4%. The primary reasons given for yesterday’s move included global stock market weakness, especially in China, and fears over rising interest rates.
If anything, days like yesterday underscore the importance of diversification. While Information Technology stocks account for much of the gains this year, they sold off more than defensive sectors, such as Consumer Staples. Small-cap stocks also held up better than Large-caps. Rotations in and out of certain types of stocks happen and happen quickly. This is a good reminder why we stay invested across all economic sectors even when a sector struggles relative to the others.
The macro story is still largely positive and, while the economy is not the stock market, strong economic activity is the long-term driver of corporate earnings and thus prices. Globally, 93% of countries have growing economies and U.S. companies, despite positive year-to-date returns, are cheaper now than they were at the start of the year as earnings growth has outpaced growth in stock prices. The fundamentals remain strong.
Prior to this week, we enjoyed a period of tranquil markets as there was not a move in the S&P 500 of 1% or more in any trading session during the third quarter. If you recall, there was a similar situation in 2017. These extended bouts of calm contrast sharply against the sudden 3-4% drop. Despite the barrage of notifications pushing headlines designed to grab attention, the truth is this type of move is typical. On average, there are 3.5 days like it a year.
Yes, stocks sold off yesterday and, yes, they could continue selling off. Or they could continue setting all-time highs.
Rather than react and make big investment decisions based on a bad down day(s), we encourage investors to reflect on what a 4% decline actually means for them and their financial future (if anything at all). Are there pending life events that might require you to balance your portfolio with additional, less volatile asset classes? Are you on track to meet your goals regardless of short-term market movements?
We are here and willing to have a conversation to discuss your questions and concerns. While we won’t be adjusting portfolios based on short-term gyrations, we acknowledge these movements can be scary and are available to listen.
You need a clear strategy to protect and build your investments and assets. We always say “a great life doesn’t plan itself.” You need someone alongside whom you can trust and help you figure it all out.
Getting help is simpler than you might think:
1. We listen.Let’s have a conversation where you ask us your questions and tell us what you’d like to achieve to find out how we can help.
2. Get clarity.
Even before becoming a client, we present you with a custom plan – not a run-of-the-mill package.
3. We help you make it happen.
Consider us a partner that connects with you frequently and makes sure we are still on target to meet your specific goals.
Stop feeling stuck in a never-ending cycle of pitches that don’t fit your needs. Instead, let Burney give you peace of mind and experience our care, competence, and customized approach to wealth management.
The Burney Company is an SEC-registered investment adviser. Burney Wealth Management is a division of the Burney Company. Registration with the SEC or any state securities authority does not imply that Burney Company or any of its principals or employees possesses a particular level of skill or training in the investment advisory business or any other business. Burney Company does not provide legal, tax, or accounting advice, but offers it through third parties. Before making any financial decisions, clients should consult their legal and/or tax advisors.
